A very simple summary of August 4th week:
Best. Week. Ever.
49.2 million vaccinations between Aug 22-28.
1/
Best. Week. Ever.
49.2 million vaccinations between Aug 22-28.
1/
https://twitter.com/surajbrf/status/1429678592171020291

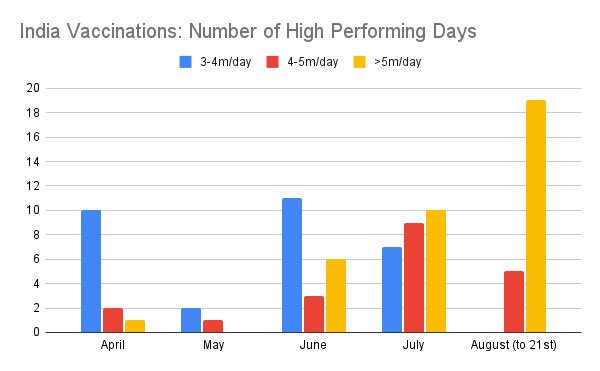
It included the first instance of a day of >10 million vaccinations, in a week where the worst weekday was 5.6 million. This new chart reports daily number for the past 3 months broken into buckets:
2/
2/

This new chart was necessitated by the fact that every day is now over 5m. 4 weeks of August are:
19 days >5m
5 days of 4-5m
4 Sundays
The data above 5m is so frequent and varied that it does not work as a single bucket anymore.
3/
19 days >5m
5 days of 4-5m
4 Sundays
The data above 5m is so frequent and varied that it does not work as a single bucket anymore.
3/

This was also the best month ever. Currently at 162 million with three more days to go. There’s a Sunday and Krishna Janmashtami, so the government appears to have worked hard to get nearly 20 million doses done just on Fri+Sat.
4/
4/

India only started general vaccinations on March 1. Until then, like several countries including Japan, India only vaccinated the healthcare and frontline workers. Since the start of general vaccinations, here are the numbers to date:
5/
5/

The data is even more revealing looking at performance since beginning of June - India significantly outperforms the European Union and United States combined, and is close to EU + North America combined.
6/
6/

With 630 million doses done, over 50% of adult population - 485 million - have a single dose. Nearly 150 million are fully vaccinated, a number that will rise significantly in the next few weeks as a large number of June first doses become eligible.
7/
7/
September should see the fully vaccinated count increase by 100 million, even as total vaccinations for that month remain on track to exceed the 200 million mark based on early production estimates, with SII alone indicating 200m output.
8/
8/
August should end with 640-650 million cumulative, with September estimated to add another 200m+ . Given successive months of over-delivering on promises (131m vs 120m in July, 162m+ vs 150m in Aug), one can make their own guesses for September performance.
9/
9/
September has significant upside surprise potential due to potential availability of new vaccines like Corbevax, which could result in a monthly total near quarter billion, i.e. vaccinating an entire Japan every 2 weeks.
And of course, all of these are Made in India.
10/10
And of course, all of these are Made in India.
10/10
• • •
Missing some Tweet in this thread? You can try to
force a refresh


