How to get URL link on X (Twitter) App

https://twitter.com/surajbrf/status/1858400457518899208
 Fast forward 15 years to 2000. Not a lot has changed. It wasn't a mischaracterization'for India to be viewed on par with Sub-Saharan Africa well into the 2000s - income wise India was middle of this pack . That's just how bad things were 50 years into the republic.

 In terms of broad peer groups, this is in the same range as lower SE Asia, Middle East, Central Asia and South America.


https://twitter.com/meghupdates/status/1783452004872056995
 The IPL is also far more lucrative in revenue per game, despite the fact that with a mere 74 games, it’s in the bottom 5 of sports leagues by number of games played per season.

https://twitter.com/PiyushGoyal/status/1514226347681681412There are only three countries on the planet with $1 trillion+ exports - China, USA and Germany. Even Japan is around $850-900B in FY 2021.

https://twitter.com/surajbrf/status/1492534010383241216
 The monthly total to date is now almost 88 million. February should easily cross 100 million and will likely finish at around 125 million. This is expected as it is predominantly second dose + boosters. March will be much higher as the 12+ group becomes eligible.

https://twitter.com/surajbrf/status/1487595558076559361
 This Is because the weekly numbers dropped to just 5.5-6.5 million this week, driven mostly by a drop in first dose numbers.

https://twitter.com/bbherre/status/1489647868868763652So how do you fix sampling error ? You get a small number of people to agree - keeping pop standard deviation down because sample size is tiny.


https://twitter.com/surajbrf/status/1477189770484731904
 Total transaction count for the same trailing 12 month period (Feb 2021 - Jan 2022) has crossed 40 billion, to reach 41.06 billion transactions:

https://twitter.com/surajbrf/status/1484962827643199494
 The bucket view itself indicates the expected slow week due to Republic Day.

https://twitter.com/surajbrf/status/1479877438335193088

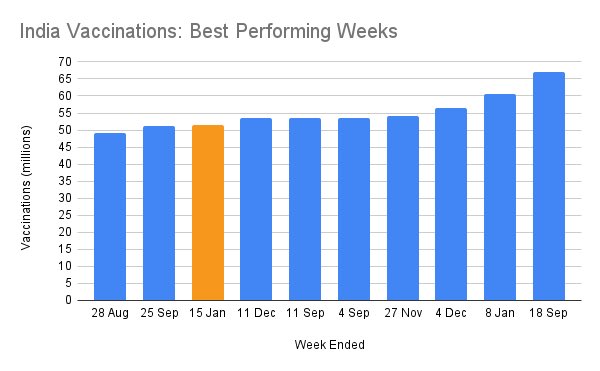
 The week itself was affected by Makar Sankranti / Lohri holidays, dropping down to mid 7 million/day later in the week. However, it still totaled nearly 52 million doses, enough for a place in the 10 best weeks ever:

https://twitter.com/lfrayer/status/1481821046642810880
 Respect. Fairness. Honesty. Accuracy.


https://twitter.com/surajbrf/status/1475886244424945666
 The past week was the best sustained one week performance: Mon-Sat averaging 9.6 million doses/day, each day over 9m.


https://twitter.com/surajbrf/status/1455295485518893058


 Calendar year end cumulative value figures:
https://twitter.com/surajbrf/status/1467173575035473923
 Daily bucket view is very consistent - five days over 8m being a record, but all in the low 8 million range preventing a larger weekly total.

https://twitter.com/surajbrf/status/1462105038411599875
 With the strong week behind us, full month vaccination has also risen to almost 156 million doses, a great number given that vaccinations were slow for the first 1.5 weeks.

https://twitter.com/surajbrf/status/1454509239079084038
 The daily performance chart shows the past week very stable at 5.5-6.5m doses a day, typically around 2m first doses and 4m second doses, stabilizing rapidly from the little over 21 million in the week prior due to Diwali.


 2018: climate-transparency.org/wp-content/upl…


https://twitter.com/Peston/status/1455220628991139841
 And another:


 Trailing 12 month transaction volume is now 34.5 billion . This is by a distance the most of any country in the world, having gained almost 10 billion from the FY 2020-21 end volume: dazeinfo.com/2021/05/11/rea…

https://twitter.com/surajbrf/status/1451763904263065600
 October should end a shade under 180 million doses, around the same ballpark as August, despite 1.5 weeks of the Dussehra festivities.

https://twitter.com/surajbrf/status/1449453807755169794This is of course just the doses administered within India. Total production is approximately 1.25 billion, including supplies sitting with states, exports and wastage.

