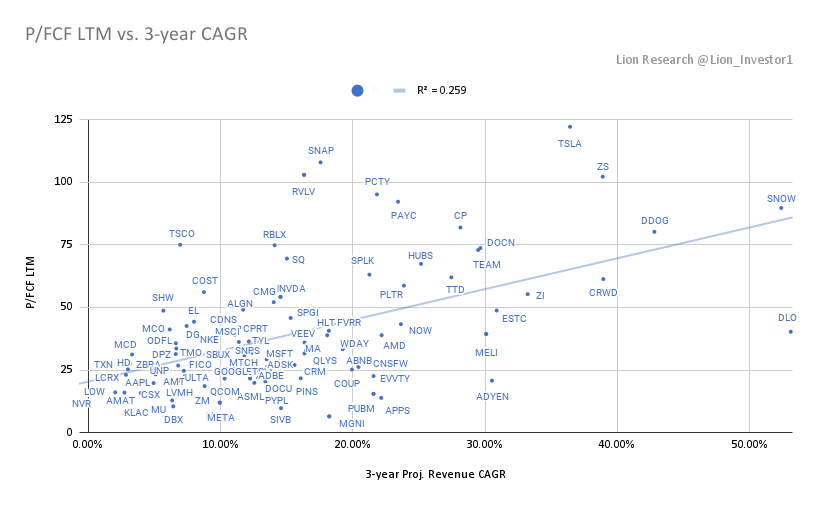
Now that most companies have reported earnings, it is a good time to assess where current valuation multiples stand and the estimates of revenue CAGR for the next few years.
This is the consolidated graph with all the companies:
This is the consolidated graph with all the companies:

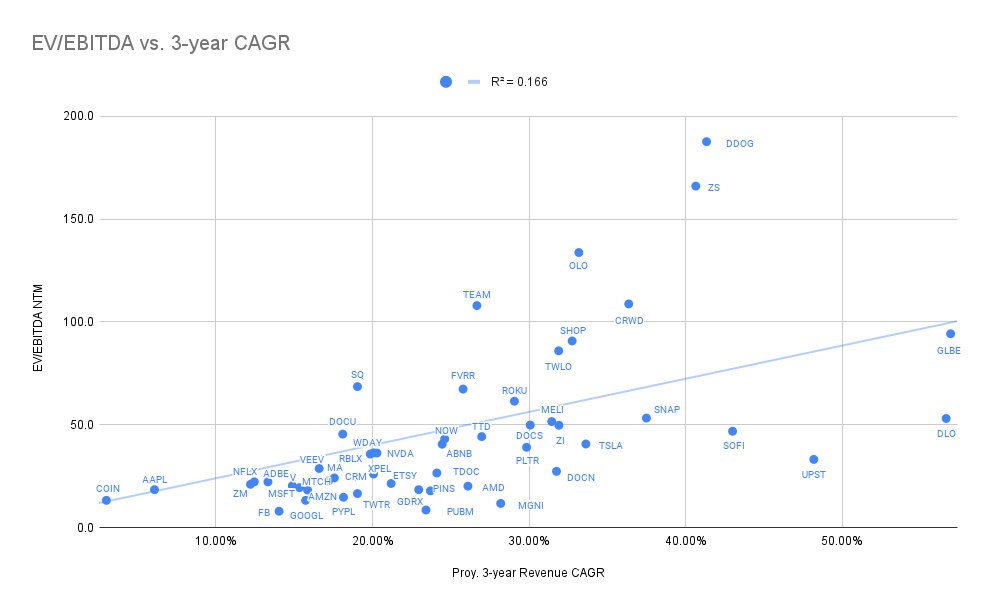
In this other one, I included some companies that I had to exclude in the first graph:
$AFRM
$SNOW
$DLO
$GLBE
The next graphs are grouped by industry.
$AFRM
$SNOW
$DLO
$GLBE
The next graphs are grouped by industry.

E-Commerce
EV/GP NTM and EV/EBITDA NTM (for profitable Cos)
$AMZN 8.4x / 20.6x
$BABA 6.5x / 12.6
$SE 36.4x
$MELI 24.4x / 123x
$JD 4x / 32x
$W 7.4x / 44x
$SHOP 66x / 266x
$CPNG 10.6x
$ETSY 14.1x / 36.64x
$PDD 9.1x
$OZON 8.1x
$BIGC 21.2x
$GLBE 116x
EV/GP NTM and EV/EBITDA NTM (for profitable Cos)
$AMZN 8.4x / 20.6x
$BABA 6.5x / 12.6
$SE 36.4x
$MELI 24.4x / 123x
$JD 4x / 32x
$W 7.4x / 44x
$SHOP 66x / 266x
$CPNG 10.6x
$ETSY 14.1x / 36.64x
$PDD 9.1x
$OZON 8.1x
$BIGC 21.2x
$GLBE 116x

Fintech and Payments
$V 22.6x / 29x
$MA 26.2x / 28.9x
$PYPL 26.3x / 40x
$SQ 22x / 109x
$COIN 9.7x / 19.3x
$AFRM 117x
$SOFI 20.3x / 94x
$UPST 22.4x / 123x
$LSPD 44x
$DLO 116x
$V 22.6x / 29x
$MA 26.2x / 28.9x
$PYPL 26.3x / 40x
$SQ 22x / 109x
$COIN 9.7x / 19.3x
$AFRM 117x
$SOFI 20.3x / 94x
$UPST 22.4x / 123x
$LSPD 44x
$DLO 116x

Social Media and Digital Ads
$FB 9.7x / 14.4x
$GOOGL 12.3x / 17.2x
$PINS 16.2x / 42.7x
$SNAP 43.8x / 150.7x
$TWTR 13.8x / 30x
$ROKU 28.6x / 124.9x
$TTD 26.9x / 79.2x
$MTCH 17x / 35x
$MGNI 13.4x / 29.2x
$PUBM 7.5x / 18.6x
$FB 9.7x / 14.4x
$GOOGL 12.3x / 17.2x
$PINS 16.2x / 42.7x
$SNAP 43.8x / 150.7x
$TWTR 13.8x / 30x
$ROKU 28.6x / 124.9x
$TTD 26.9x / 79.2x
$MTCH 17x / 35x
$MGNI 13.4x / 29.2x
$PUBM 7.5x / 18.6x

Mega Cap
$AAPL 16x / 20.2x
$MSFT 16.8x / 23.7x
$GOOGL 12.3x / 17.2x
$AMZN 8.4x / 21.6x
$FB 9.7x / 14.6x
$TCEHY 13.4x / 17.4x
$BABA 6.5x / 12.6
$TSLA 50.5x / 55x
$NVDA 32.4x / 50.9x
$NFLX 20x / 37.3x
$AAPL 16x / 20.2x
$MSFT 16.8x / 23.7x
$GOOGL 12.3x / 17.2x
$AMZN 8.4x / 21.6x
$FB 9.7x / 14.6x
$TCEHY 13.4x / 17.4x
$BABA 6.5x / 12.6
$TSLA 50.5x / 55x
$NVDA 32.4x / 50.9x
$NFLX 20x / 37.3x

SAAS
$TWLO 37.6x / 268x
$DOCU 35.2x / 134x
$SPLK 12.7x
$WDAY 16.4x / 46x
$NET 67.8x
$FSLY 23.1x
$PD 13.5x
$ADBE 21.3x / 37.8x
$ZM 33.3x / 63
$TEAM 41.9x
$SNOW 98.4x
$CRM 12.4x / 33x
$VEEV 33x / 65x
$CRWD 52x / 317x
$DDOG 42x / 277x
$OLO 36x
$NOW 24x / 61x
$OKTA 40x
$MDB 44x
$TWLO 37.6x / 268x
$DOCU 35.2x / 134x
$SPLK 12.7x
$WDAY 16.4x / 46x
$NET 67.8x
$FSLY 23.1x
$PD 13.5x
$ADBE 21.3x / 37.8x
$ZM 33.3x / 63
$TEAM 41.9x
$SNOW 98.4x
$CRM 12.4x / 33x
$VEEV 33x / 65x
$CRWD 52x / 317x
$DDOG 42x / 277x
$OLO 36x
$NOW 24x / 61x
$OKTA 40x
$MDB 44x

Real Estate / Healthcare / Gig Economy / Gaming / Other
$FVRR 23.7x / 241x
$UPWK 13.9x / 170x
$Z 6.9x / 44.6x
$ABNB 18.5x / 67x
$RDFN 12.1x
$PTON 14.4x / 101x
$TDOC 15.4x / 72x
$GDRX 17.2x / 50x
$EGLX 15.7x
$SKLZ 8x
$AMD 17.6x / 31.1x
$RBLX 22.2x / 71x
$XPEL 21.7x / 41.4x
$FVRR 23.7x / 241x
$UPWK 13.9x / 170x
$Z 6.9x / 44.6x
$ABNB 18.5x / 67x
$RDFN 12.1x
$PTON 14.4x / 101x
$TDOC 15.4x / 72x
$GDRX 17.2x / 50x
$EGLX 15.7x
$SKLZ 8x
$AMD 17.6x / 31.1x
$RBLX 22.2x / 71x
$XPEL 21.7x / 41.4x

Valuation and growth are just some of the variables to take into account. But once you know a company really well, it can help to add at better valuations over time.
I have a feeling this is going to be an interesting September/October period. Let's keep compounding! 🔥📈
I have a feeling this is going to be an interesting September/October period. Let's keep compounding! 🔥📈
Sharing with some friends:
@BackpackerFI @Invesquotes @caleb_investTML @Couch_Investor @Innovestor_ @7Innovator @IrnestKaplan @InvestmentTalkk @EugeneNg_VCap @StockMarketNerd @Brian_Stoffel_ @NeuroStockDoc @Mayhem4Markets @borrowed_ideas @skaushi @Keith_Wasserman @Badpak
@BackpackerFI @Invesquotes @caleb_investTML @Couch_Investor @Innovestor_ @7Innovator @IrnestKaplan @InvestmentTalkk @EugeneNg_VCap @StockMarketNerd @Brian_Stoffel_ @NeuroStockDoc @Mayhem4Markets @borrowed_ideas @skaushi @Keith_Wasserman @Badpak
• • •
Missing some Tweet in this thread? You can try to
force a refresh