Remarkable detail about NYC infrastructure:
Sewer system designed to accommodate a 5-year storm, one with a 20% chance of occurring in any year
Like the Texas freeze, events are exposing poor infrastructure & limited capacity to deal with rare events
www1.nyc.gov/assets/em/down…
Sewer system designed to accommodate a 5-year storm, one with a 20% chance of occurring in any year
Like the Texas freeze, events are exposing poor infrastructure & limited capacity to deal with rare events
www1.nyc.gov/assets/em/down…

Flooding in NYC is highly correlated with sewer infrastructure (look at Queens)
mdpi.com/2073-4441/9/10…
mdpi.com/2073-4441/9/10…

Honestly, if I am a NY politician, given these facts, all I'd be talking about is climate change
No one in NYC gov't should be surprised by flooding
Hamidi et al 2018. Uncertainty analysis of urban sewer system using spatial simulation of radar rainfall fields: New York City case study. SERRA 32:2293-2308.
link.springer.com/article/10.100…
Hamidi et al 2018. Uncertainty analysis of urban sewer system using spatial simulation of radar rainfall fields: New York City case study. SERRA 32:2293-2308.
link.springer.com/article/10.100…

NY and NJ are hotspots for inland flooding from tropical cyclones
Villarini et al 2014. North Atlantic tropical cyclones and US flooding. BAMS 95:1381-1388.
journals.ametsoc.org/view/journals/…
Villarini et al 2014. North Atlantic tropical cyclones and US flooding. BAMS 95:1381-1388.
journals.ametsoc.org/view/journals/…

NYC days with rainfall >4in 1900 to 2010
A >4in rainfall in one day was a 1 in ~3 year event in NYC
New York City Panel on Climate Change 2010 Report
nyaspubs.onlinelibrary.wiley.com/doi/full/10.11…
A >4in rainfall in one day was a 1 in ~3 year event in NYC
New York City Panel on Climate Change 2010 Report
nyaspubs.onlinelibrary.wiley.com/doi/full/10.11…

"Extreme rainfall measured at Central Park has
significant year-to-year variation such that no statistically significant trends in extreme rainfall can be
identified (Horton et al., 2015)"
New York City Panel on Climate Change 2019 Report
researchgate.net/profile/Jorge-…
significant year-to-year variation such that no statistically significant trends in extreme rainfall can be
identified (Horton et al., 2015)"
New York City Panel on Climate Change 2019 Report
researchgate.net/profile/Jorge-…
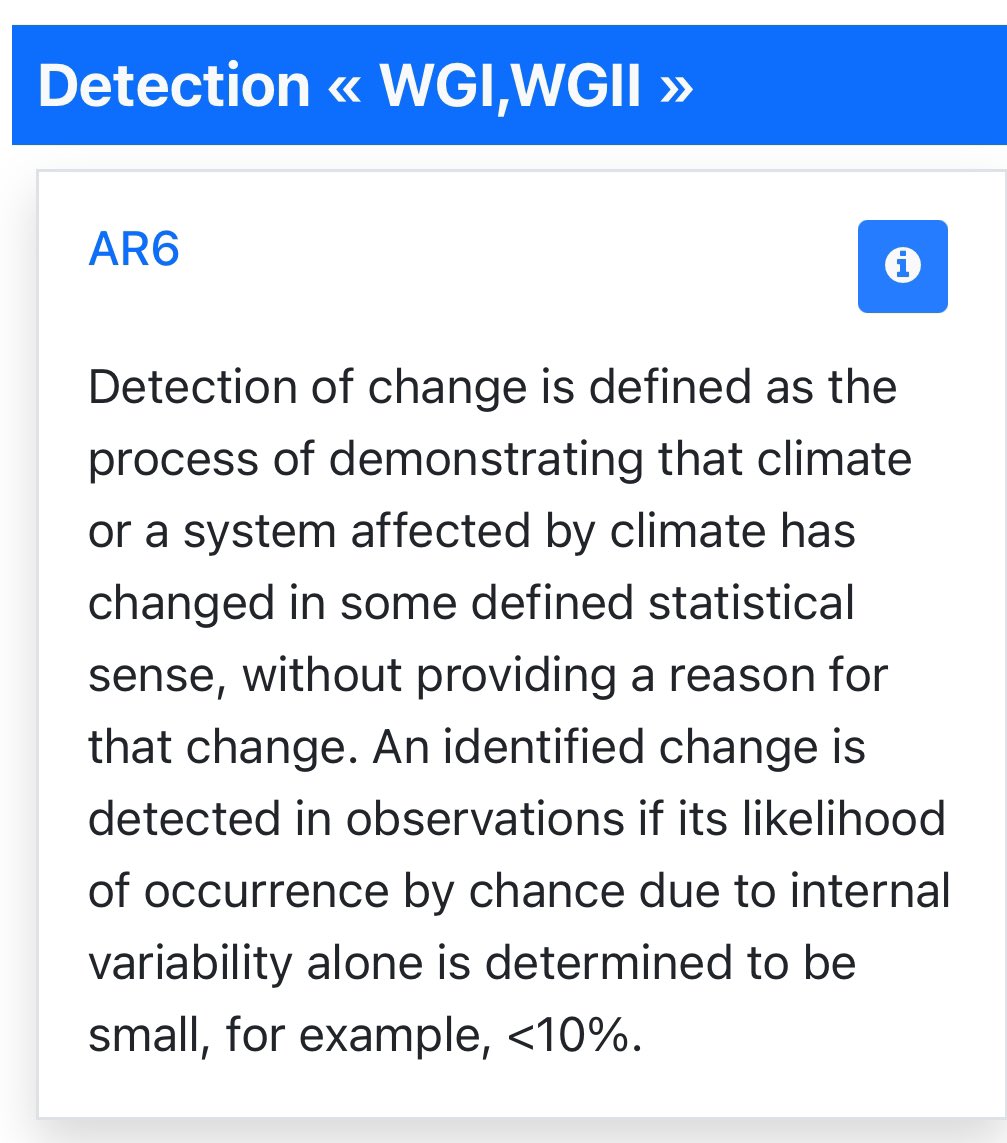
The effects of climate change on extreme precip were said to be not detectable in the 2020s, in NYC Panel on Climate Change 2019 Report
So if this week's floods show clear fingerprints of climate change, then the mayor of New York is right to say that this event was unexpected
So if this week's floods show clear fingerprints of climate change, then the mayor of New York is right to say that this event was unexpected

Interestingly the current NYC Storm Water Resiliency Plan discusses plans for an extreme rainfall event of 3.5 inches falling in 1 hour 9this week say 3.15 in one hour), which it defines with a return period of 100 yrs
www1.nyc.gov/assets/orr/pdf…
www1.nyc.gov/assets/orr/pdf…

So there are mixed messages here
A. This week's storm was the result of climate change - in which case policy makers were not warned
B. This week's storm was a ~100-yr flood indistinguishable from natural variability, in which case policy makers were unprepared
Pick one
A. This week's storm was the result of climate change - in which case policy makers were not warned
B. This week's storm was a ~100-yr flood indistinguishable from natural variability, in which case policy makers were unprepared
Pick one
For politicians, there's obvious incentives to pick A
For activist scientists trying to sell the NYC flood as a reason for broader emissions policy, a collateral effect is to provide cover for politicians who dropped the ball in local NYC flood/stormwater policy & infrastructure
For activist scientists trying to sell the NYC flood as a reason for broader emissions policy, a collateral effect is to provide cover for politicians who dropped the ball in local NYC flood/stormwater policy & infrastructure
Why NYC Is Still So Unprepared For Flash Floods wnyc.org/story/why-nyc-… via @WNYC
• • •
Missing some Tweet in this thread? You can try to
force a refresh


