
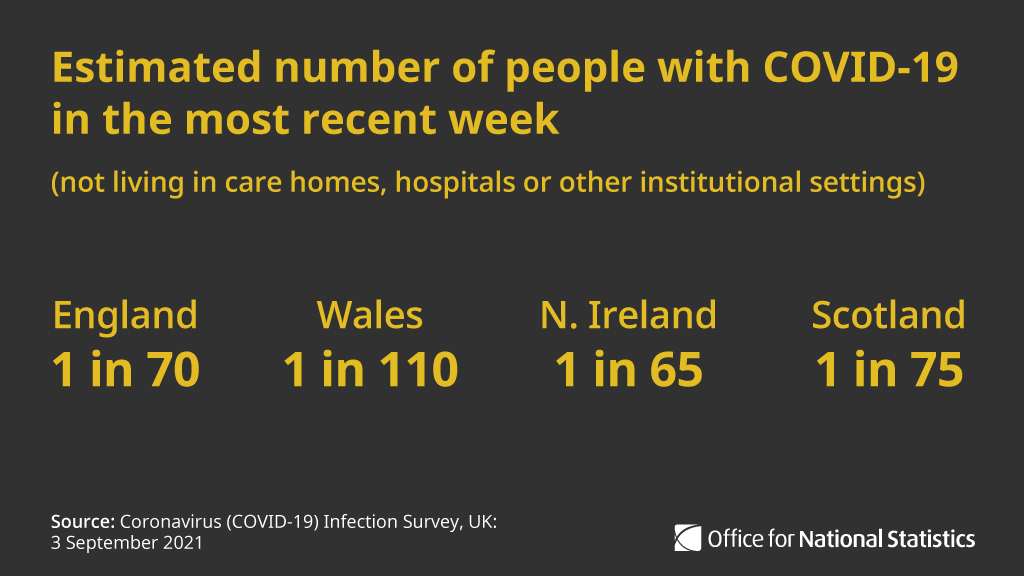
Latest #COVID19 estimates show infection rates are level in England in the week ending 27 August 2021.
Rates have decreased in Northern Ireland, increased in Scotland and the trend is uncertain in Wales in the week ending 28 August 2021 ow.ly/7awB50G3H6T
Rates have decreased in Northern Ireland, increased in Scotland and the trend is uncertain in Wales in the week ending 28 August 2021 ow.ly/7awB50G3H6T
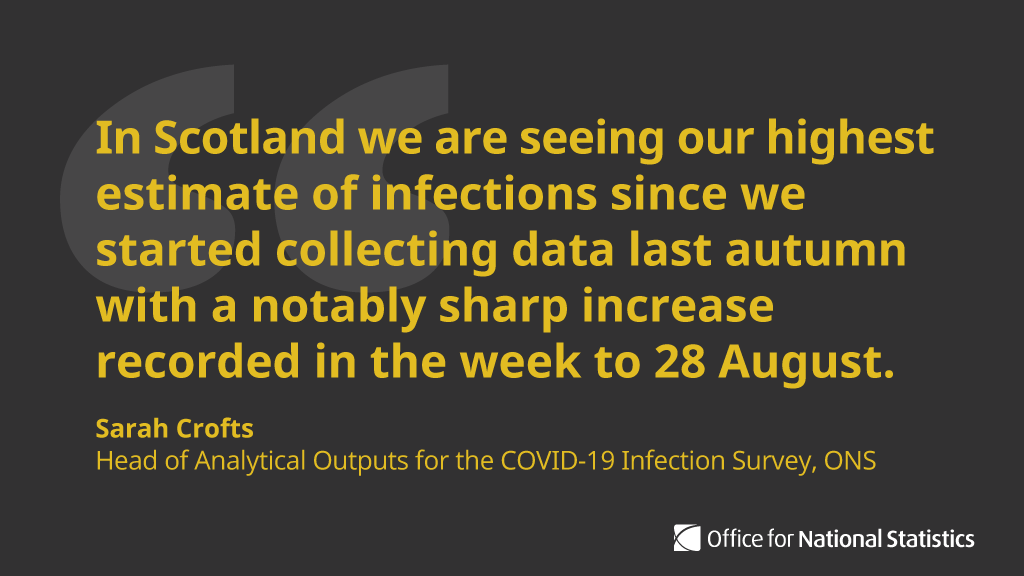
Commenting on the results for Scotland, Sarah Crofts, Head of Analytical Outputs for the #COVID19 Infection Survey, said: (1/2)
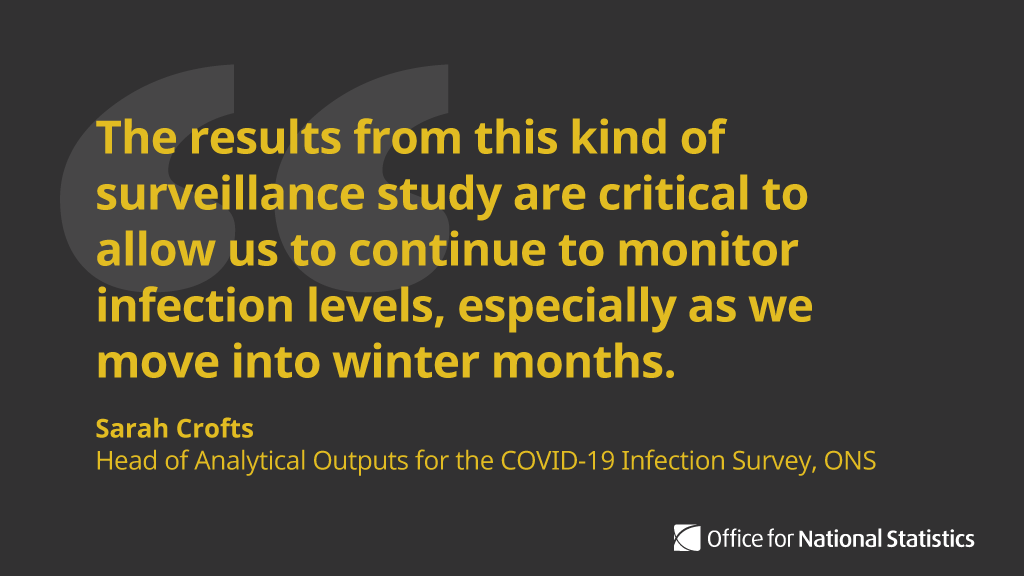
Sarah Crofts continued: (2/2)
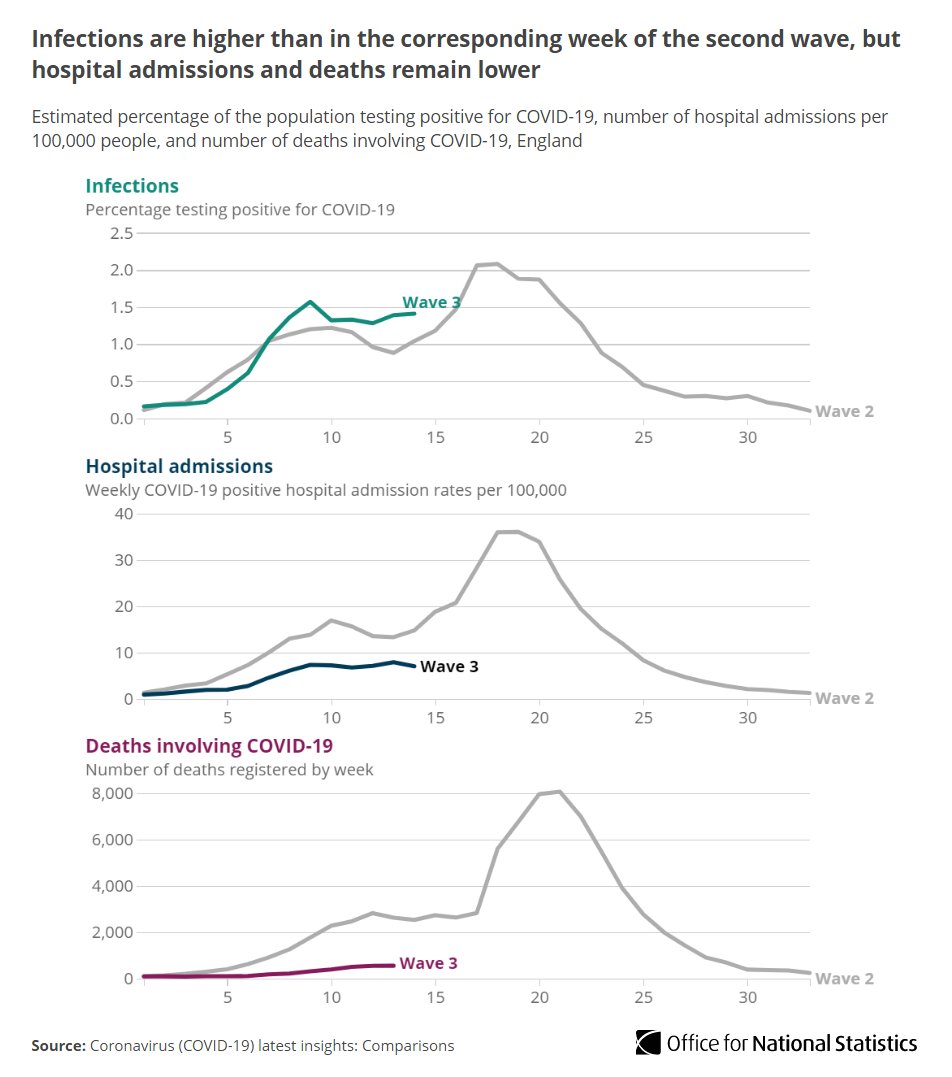
#COVID19 infections continued to be higher in the week ending 27 August 2021 than in the corresponding week of the second wave (week ending 12 December 2020) ow.ly/BvTl50G3HxO
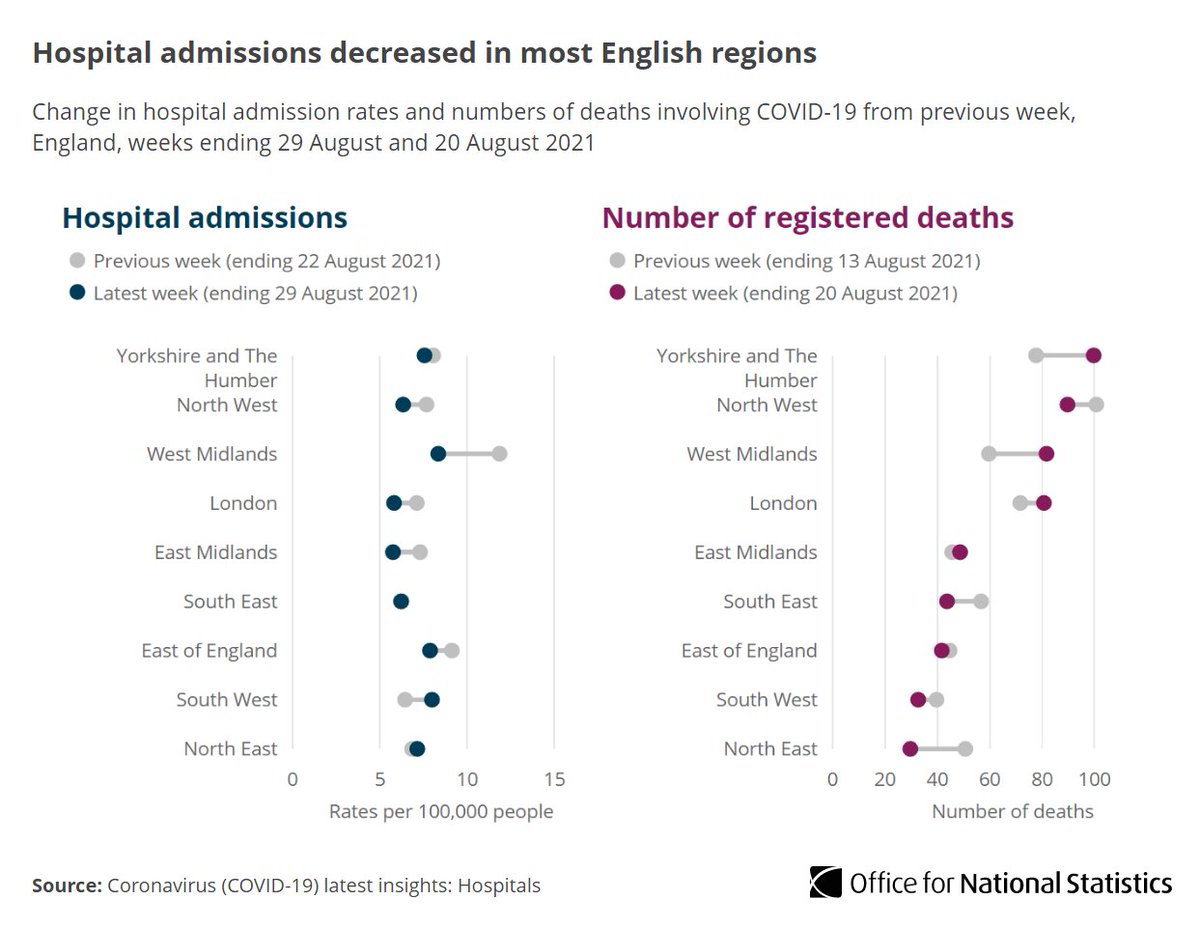
Hospital admissions in England decreased in the week ending 29 August 2021.
The largest decrease in admissions was seen in the West Midlands and the largest increase was seen in the South West ow.ly/8qwZ50G3HBk
The largest decrease in admissions was seen in the West Midlands and the largest increase was seen in the South West ow.ly/8qwZ50G3HBk
• • •
Missing some Tweet in this thread? You can try to
force a refresh


