
Updating for 1st week of Sept, with the risk of sounding like a broken record:
* This week overtook last week as the best week ever.
* First ever instance of >50 million in a week, finishing with 53.6M
1/
* This week overtook last week as the best week ever.
* First ever instance of >50 million in a week, finishing with 53.6M
1/
https://twitter.com/surajbrf/status/1431648322851205129

Updating the bucket chart of daily number classification shows just how much the recent performance has accelerated, with multiple >10M days interspersed between >6M days.
All data is at intervals between PIB 7pm data.
2/
All data is at intervals between PIB 7pm data.
2/

I’ve summarized the month of August itself separately and written an article about it:
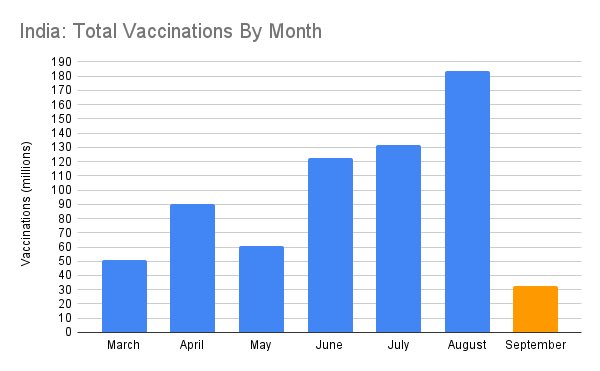
Three months of successively outdoing projections culminated in a record 185m doses in August, vs 150m projected.
3/
https://twitter.com/swarajyamag/status/1433037433294131203?s=21
Three months of successively outdoing projections culminated in a record 185m doses in August, vs 150m projected.
3/
https://twitter.com/surajbrf/status/1432718256381562883
The following chart reports monthly vaccination dose performance so far. A mere 4 days in, September already has almost 33 million doses, enough to vaccinate the eligible population of Canada, or Aus+NZ combined.
4/
4/
I had stopped showing vaccine availability with states data as it was briefly stopped being reported.
Tl;dr - It has now resumed and the trend is again visible.
The float is higher now, but 45-50m is reasonable given it is less than a weeks inventory now:
5/
Tl;dr - It has now resumed and the trend is again visible.
The float is higher now, but 45-50m is reasonable given it is less than a weeks inventory now:
5/

Let’s step back and look at how vaccination coverage numbers look vs major regions .
Half a billion people (well past 50%) adults with at least a dose, adding ~1% a day peak rate.
Note the slope of various entities as it matters in subsequent posts on this thread.
6/
Half a billion people (well past 50%) adults with at least a dose, adding ~1% a day peak rate.
Note the slope of various entities as it matters in subsequent posts on this thread.
6/

The 7DMA data now looks a little comical, with the Indian rate exceeding combined rates of others, whose combined population exceeds India’s.
As a result, Indian rate per person also exceeds them. The “but we have more people” argument doesn’t quite work well now.
7/
As a result, Indian rate per person also exceeds them. The “but we have more people” argument doesn’t quite work well now.
7/

In my article on @SwarajyaMag summarizing August, I described the pronounced acceleration in Indian supply vs EU/US.
Vaccine prod faces scaling problems. @SerumInstIndia struggled earlier and @BharatBiotech is working hard now. They need support, not backseat criticism.
8/
Vaccine prod faces scaling problems. @SerumInstIndia struggled earlier and @BharatBiotech is working hard now. They need support, not backseat criticism.
8/
This is the prior quarter (June-August) performance vs Europe and North America.
Europe = entire continent incl UK, not merely EU
NA = US + CA + Mex
From almost matching Europe, to exceeding 2 continents combined, in 3 months. That is the acceleration seen from India.
9/
Europe = entire continent incl UK, not merely EU
NA = US + CA + Mex
From almost matching Europe, to exceeding 2 continents combined, in 3 months. That is the acceleration seen from India.
9/

Many artifacts are visible in the previous picture:
1. Dramatic growth in supply and daily vaccination in India
2. Moderation in the west - both production and consumption.
A simple explanation is ‘well they’re almost done, we have a long way to go’. Let us examine:
10/
1. Dramatic growth in supply and daily vaccination in India
2. Moderation in the west - both production and consumption.
A simple explanation is ‘well they’re almost done, we have a long way to go’. Let us examine:
10/

Projections come with caveats:
* previous table doesn’t count booster doses etc.
* simply projects forward September vaccination rate estimates.
In short, disclaimers apply.
Bottomline: Indian completion timeline currently aligns with western ones.
11/
* previous table doesn’t count booster doses etc.
* simply projects forward September vaccination rate estimates.
In short, disclaimers apply.
Bottomline: Indian completion timeline currently aligns with western ones.
11/
For September, known data are:
52-55m doses carried over from Aug
200m SII est
35m BB est
Thats ~250M doses + float. Month-end total ~900M.
The estimated 100M second doses will take fully vaccinated pop over 250M.
Congrats @PMOIndia @MoHFW_INDIA and the producers!
12/12
52-55m doses carried over from Aug
200m SII est
35m BB est
Thats ~250M doses + float. Month-end total ~900M.
The estimated 100M second doses will take fully vaccinated pop over 250M.
Congrats @PMOIndia @MoHFW_INDIA and the producers!
12/12
• • •
Missing some Tweet in this thread? You can try to
force a refresh


