Institute for Fiscal Studies Profile picture
Sep 6, 2021 5 tweets 3 min read Read on X
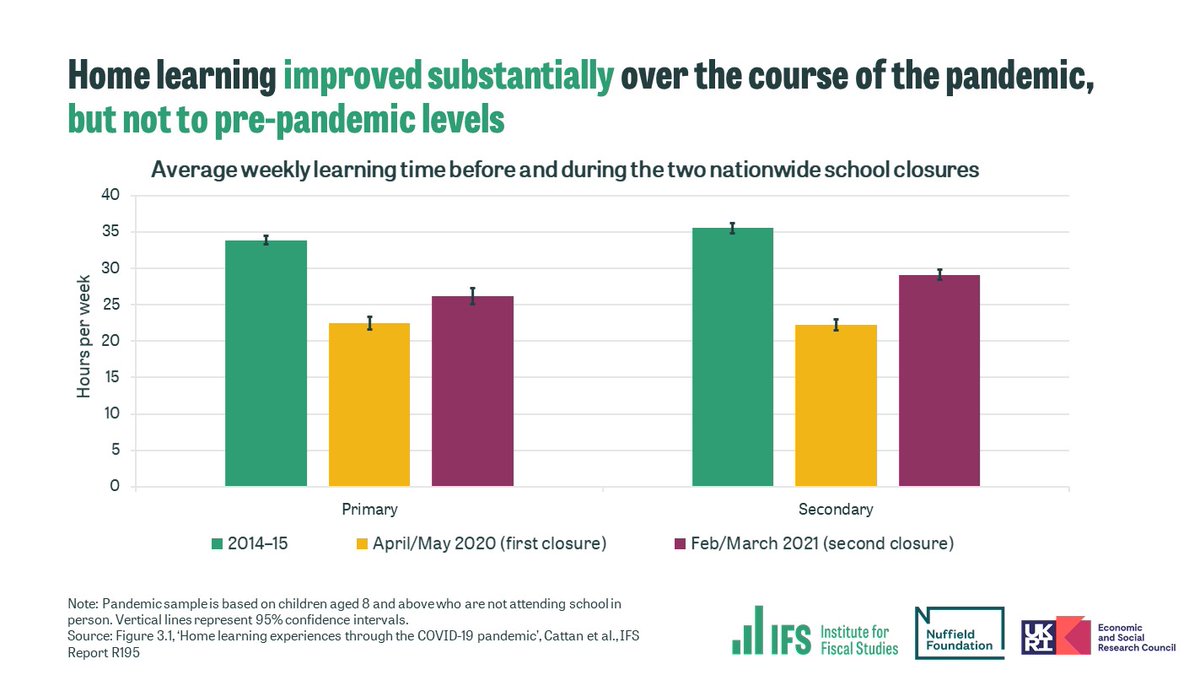
NEW: Home learning improved substantially over the course of the pandemic – but this still leaves huge learning inequalities from the first lockdown baked in.

Read our new @NuffieldFound funded report on learning inequalities > ifs.org.uk/publications/1…

[THREAD 1/5] Image
Secondary school students’ learning time rose from 22 hours per week in the first lockdown to 29 hours in the second school closures.

Despite these improvements, 40% of children still did not meet the government’s minimum guidelines for learning time.

[2/5] Image
In Autumn 2020, only 40% of pupils were offered interactive resources like online classes for self-isolating.

Support was worse for poorer pupils; 43% of secondary school pupils from the richest families were offered online classes, compared to 35% of poorer pupils.

[3/5] Image
Home learning inequalities improved from the first to the second lockdown.

During the first lockdown, children from the poorest 20% of families did nearly 8 fewer hours of learning a week than the richest 20%.

By Feb/Mar 2021, their learning hours were roughly the same.

[4/5] Image
But with a quarter of parents believing that it will take their child at least a year to catch up, schools and teachers will face big challenges this year.

Catch-up programmes need to ensure the pupils who most need the support can access it.

ifs.org.uk/publications/1…

[5/5] Image

• • •

Missing some Tweet in this thread? You can try to force a refresh
 

Keep Current with Institute for Fiscal Studies

Institute for Fiscal Studies Profile picture

Stay in touch and get notified when new unrolls are available from this author!

Read all threads

This Thread may be Removed Anytime!

PDF

Twitter may remove this content at anytime! Save it as PDF for later use!

Try unrolling a thread yourself!

how to unroll video
  1. Follow @ThreadReaderApp to mention us!

  2. From a Twitter thread mention us with a keyword "unroll"
@threadreaderapp unroll

Practice here first or read more on our help page!

More from @TheIFS

Jun 24
STARTING NOW: @PJTheEconomist opens our IFS event analysing the 2024 General Election manifestos:

📺 Watch live here:

Ask questions here:
app.sli.do/event/9esN5Dd8…
- @PJTheEconomist: The "raw facts" on the public finances and funding for public services "are largely ignored by the two main parties in their manifestos."

"They have singularly failed even to acknowledge some of the most important issues and choices."
@PJTheEconomist Low growth, high debt and high interest payments means "to stop debt spiralling ever upwards we need to run primary surpluses."

"That means the government collecting more in tax and other revenues than it spends on everything apart from debt interest."

- @PJTheEconomist
Read 15 tweets
Jun 11
NEW: In advance of the Conservatives confirming their tax plans for the future today, we've assessed their record on tax policy in last 14 years.

THREAD on @HelenMiller_IFS, @StuartAdam_IFS and Bobbie Upton's new report, funded by @NuffieldFound @finan_fairness:

[1/11] Image
Tax revenue as a share of national income, at 36%, is higher now than at any point since 1948 and forecast to rise further.

The 2019-24 parliament saw the biggest rise in the tax take of any parliament in modern history.

[2/11] Image
The composition of revenue has changed.

Relative to 2010, more tax revenue is being raised from income tax, VAT, corporation tax and capital taxes. Less is being raised from fuel and tobacco duties and business rates.

[3/11] Image
Read 12 tweets
Jun 9
NEW: The size of the state – spending as a proportion of national income – has increased by significantly more under this parliament than under any previous post-war Conservative parliament. A large part of this increase looks to be permanent.


[🧵: 1/11] ifs.org.uk/publications/h…
Image
The state was the same size in 2019-20 as it was in 2007-08.

Almost a decade of austerity simply reversed the growth in the state that happened during the financial crisis, and returned the size of the state to where it had been after a decade of New Labour governments.

[2/11] Image
Returning the size of the state to 2007-08 levels after the financial crisis meant very slow spending growth over the 2010s compared to the historic average, particularly in a context of relatively weak economic growth.

[3/11] Image
Read 11 tweets
Jun 4
NEW: There will be no easy options when it comes to schools funding after the #GeneralElection.

@lukesibieta’s new @NuffieldFound-funded report explains why the next government faces painful choices on school spending:

[THREAD: 1/8] Image
Since 2019, a £6 billion increase in school spending has taken real-terms spending per pupil back to 2010 levels.

But rapid rises in staff, energy and food costs leave the purchasing power of school budgets about 4% lower than in 2010.

[2/8] Chart shows total school spending per pupil, 2009–10 = 1. Title states: "There has been no overall real-terms growth in school spending per pupil in England in over 14 years."
With an expected 5% drop in pupil numbers up to 2028, an incoming government could cut total school spending by £3.5 billion (6%) by maintaining spending per pupil in real terms.

But since many school costs are fixed in the short run, this is easier said than done.

[3/8] Chart projects options for change in total school spending in England between 2024–25 and 2028–29, 2024–25 prices. Title states: "Falling pupil numbers could allow next government to save £3.5 billion by maintaining spending per pupil in real-terms."
Read 8 tweets
Jun 3
NEW: Ahead of the election, @PJtheEconomist, @nridpathecon and Carl Emmerson look back at the economy over the last 14 years in a chapter for @anthonyseldon and @Tom_AE_123’s forthcoming book The Conservative Effect, 2010-2024.

THREAD on the UK economy since 2010:
[1/13] Image
The economy has grown only slowly since the Great Financial Crisis.

If we had continued growing at the rates seen in the 2000s, we would be on average over £10,000 richer each.

[2/13] Chart shows GDP per capita compared to pre-Recession trend. Title states: "GDP per head remains far below the pre-2008 trend and has stagnated since the pandemic."
Slow growth has been a common trend across advanced economies.

However, the UK has still lagged behind: since 2008, income per head has grown at a third of the speed of the US and half the speed of Germany.

[3/13] Chart shows GDP per capita compared to France, Germany and the US. Title states: "Other major economies have also grown slowly, but faster than the UK."
Read 13 tweets
Apr 9
NEW: Access to Sure Start greatly improved disadvantaged children’s GCSE results, by as much as three GCSE grades.

THREAD on @nridpathecon, @Sarah_Cattan and @carneiro_econ’s new report, funded by @NuffieldFound, on Sure Start’s impact on educational outcomes: [1/10] Image
Between 1999 and 2010, Sure Start expanded as a network of ‘one-stop shops’ integrating services for families with children under 5 under one roof. These ranged from ante- and post-natal health services, parenting support, early learning, childcare and employment support.

[2/10]
At its peak, Sure Start cost £2.5 billion per year.

Spending has since fallen by more than two-thirds as many centres have been closed, scaled back or integrated into Family Hubs.

[3/10]
Read 10 tweets

Did Thread Reader help you today?

Support us! We are indie developers!


This site is made by just two indie developers on a laptop doing marketing, support and development! Read more about the story.

Become a Premium Member ($3/month or $30/year) and get exclusive features!

Become Premium

Don't want to be a Premium member but still want to support us?

Make a small donation by buying us coffee ($5) or help with server cost ($10)

Donate via Paypal

Or Donate anonymously using crypto!

Ethereum

0xfe58350B80634f60Fa6Dc149a72b4DFbc17D341E copy

Bitcoin

3ATGMxNzCUFzxpMCHL5sWSt4DVtS8UqXpi copy

Thank you for your support!

Follow Us!

:(