@NuffieldFound This new report summarises our 10-year body of work on the effects of Sure Start, a network of ‘one-stop shops’ integrating services for families with children under 5. And the report provides a detailed cost-benefit analysis cutting across a range of child outcomes.
 @finan_fairness People are increasingly saving for retirement in defined contribution (DC) pensions, which do not guarantee a regular income.

 The new government has accepted in full the independent 2024 Pay Review Body recommendations, with average pay rises of 5.5%.
  There has been rapid growth in the health-related benefits caseload since 2019. 1 in 10 working-age people in England & Wales now claim a health-related benefit.
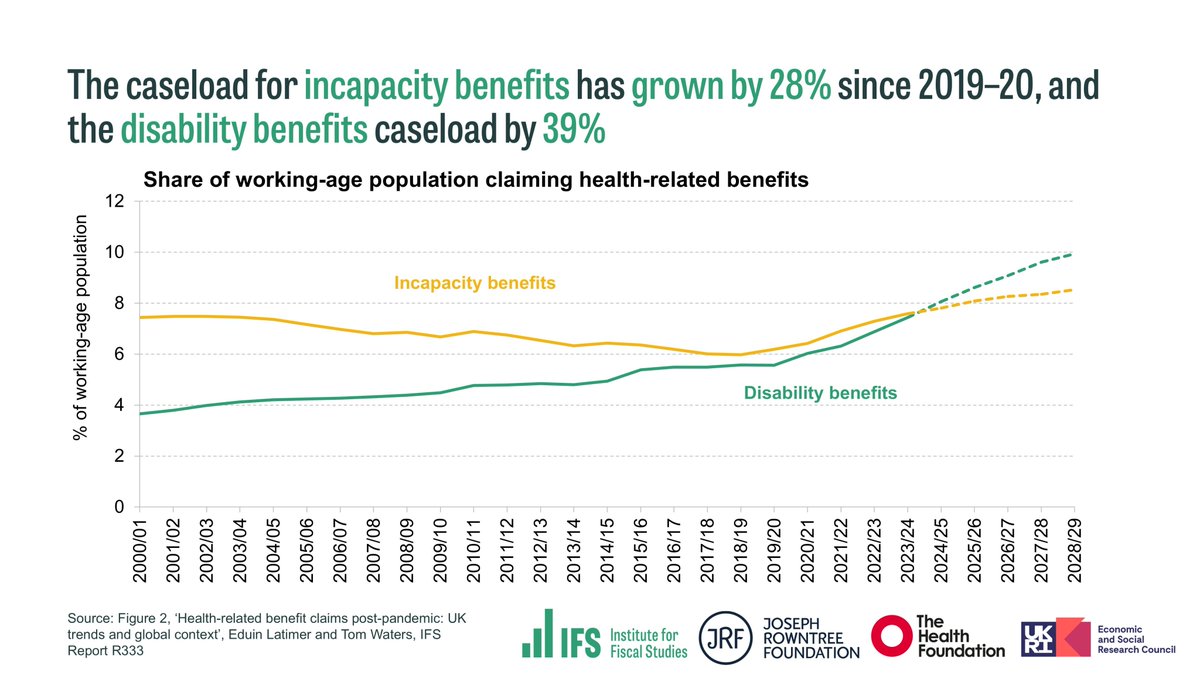
 Mortgage interest rates have risen rapidly since June 2022.

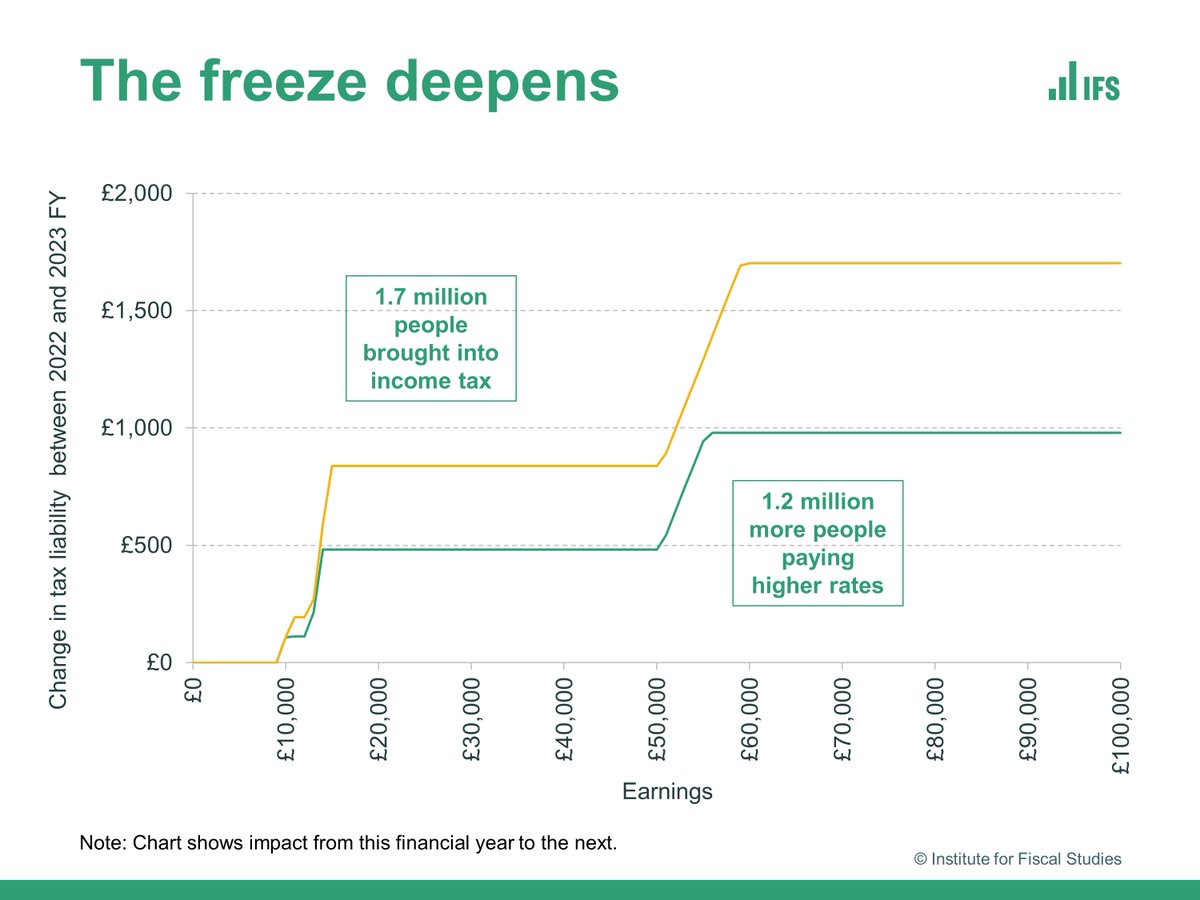
 Tax revenue as a share of national income, at 36%, is higher now than at any point since 1948 and forecast to rise further.
 The state was the same size in 2019-20 as it was in 2007-08.
 Since 2019, a £6 billion increase in school spending has taken real-terms spending per pupil back to 2010 levels.
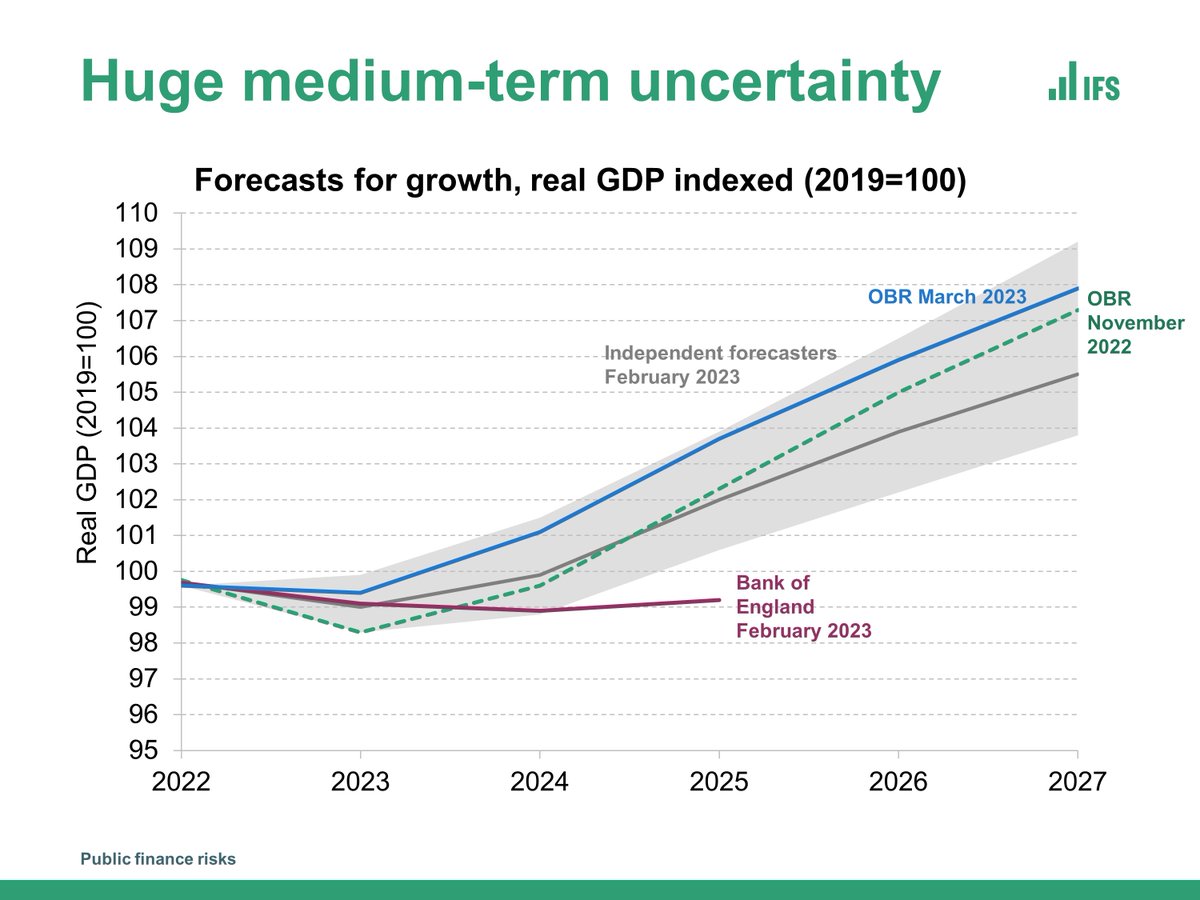
 The economy has grown only slowly since the Great Financial Crisis.
 Between 1999 and 2010, Sure Start expanded as a network of ‘one-stop shops’ integrating services for families with children under 5 under one roof. These ranged from ante- and post-natal health services, parenting support, early learning, childcare and employment support.
 Scottish students' living cost support had been eroded over time, with real-terms support for the poorest students cut by 16% (£1.6k a year) between 2013-14 and 2022-23.
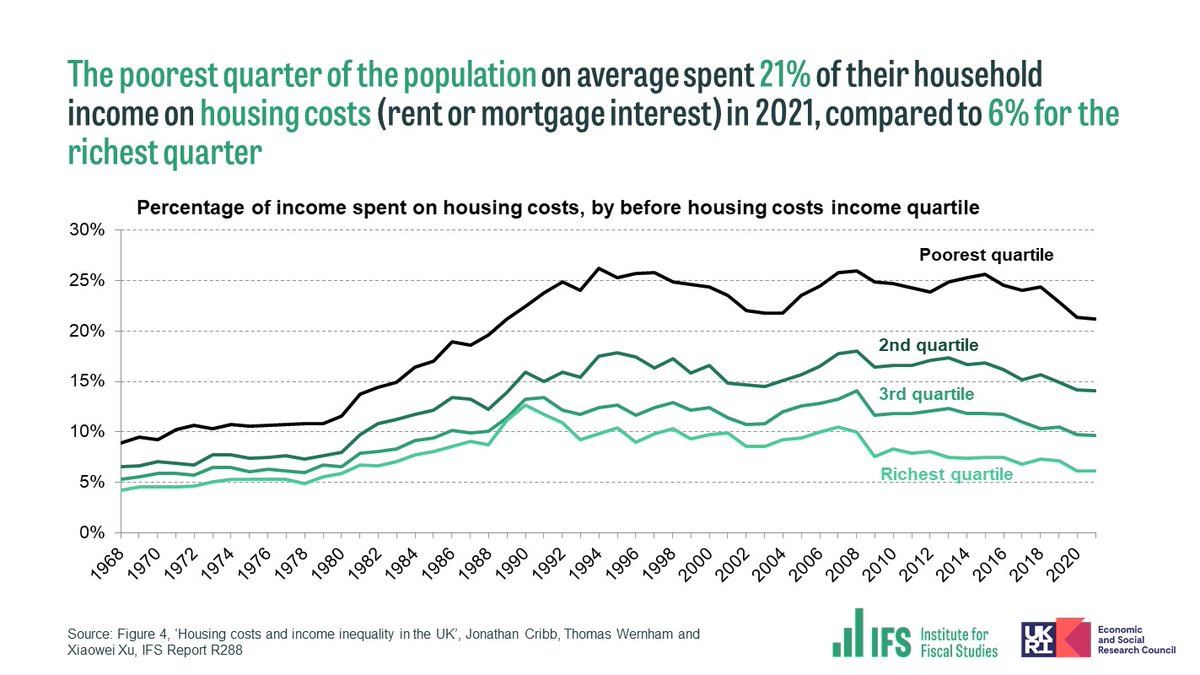 Whether we deduct housing costs from incomes makes a big difference to poverty measurement – the poverty rate is around 17% ignoring housing costs, but 22% if we deduct them.
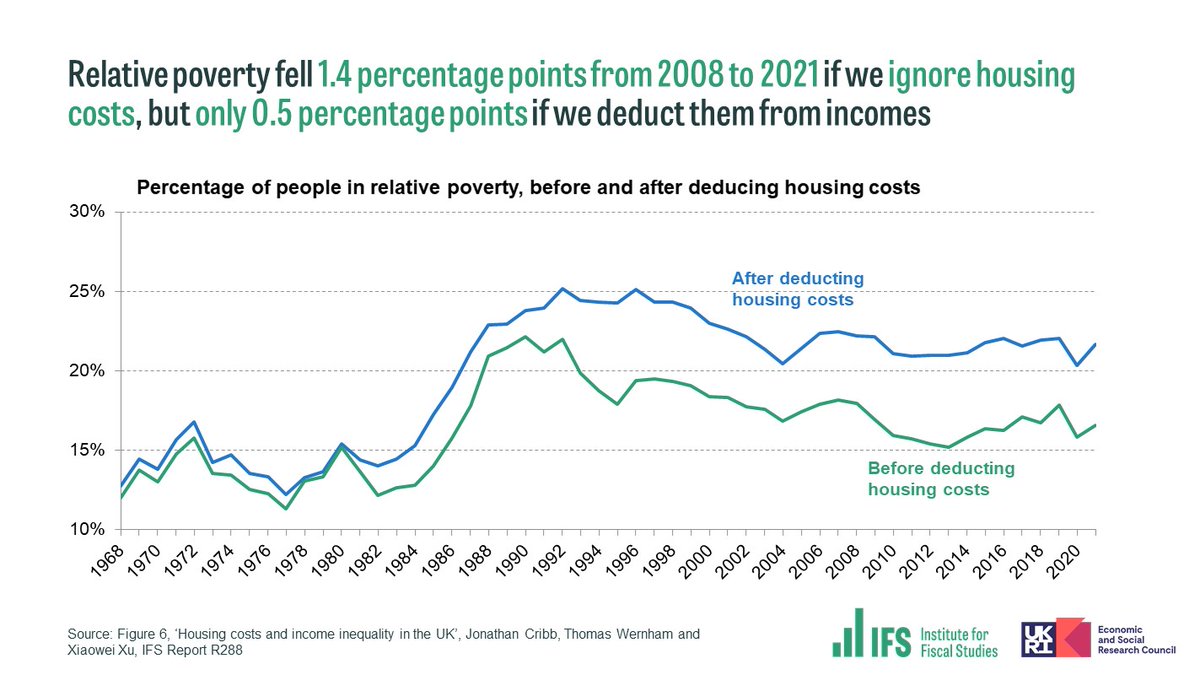
 Scotland has gone from best performing UK nation in PISA tests to being an average performer.
 Inheritances will be twice as big on average for those born in the 1980s as for those born in the 1960s.
 The economic effects of disability are also felt unequally between educational groups.