Institute for Fiscal Studies Profile picture
Sep 8, 2021 7 tweets 3 min read Read on X
NEW REPORT: In their 30s, children with parents in the wealthiest fifth of their generation had average net wealth six times greater than those with parents in the poorest fifth.

Read our @ESRC funded report on wealth inequality > ifs.org.uk/publications/1…

THREAD [1/6]
Having wealthy parents is particularly important for getting to the top of the wealth distribution.

Children of the wealthiest fifth of parents are almost three times as likely to be in the wealthiest fifth in their generation as those with average parental wealth.

[2/6]
Children of wealthier parents are much more likely to be homeowners by age 30.

65% for those with parents in the top third of the wealth distribution owned a house, compared to against 56% and 41% for those whose parents were in the middle and bottom thirds, respectively.

[3/6]
Higher-earning, more highly educated parents having higher-earning, highly educated children explains some of this.

But financial transfers from parents to children, differences in saving behaviour and differences in investment returns drives the persistence of wealth.

[4/6]
Even among those whose parents have the same levels of earnings and education, those with wealthier parents tend to earn more.

Having wealthy parents is associated with saving more as a portion of your earnings, and holding higher-risk investments like stocks and shares.

[5/6]
Our findings show it is important to consider wealth, not just earnings, when trying to promote social mobility. Young adults’ wealth is more related to their parents’ wealth than their earnings are related to their parents’ earnings.

Full report> ifs.org.uk/publications/1…

[6/6]
Watch the authors of this report present their full findings on wealth inequality now here >

• • •

Missing some Tweet in this thread? You can try to force a refresh
 

Keep Current with Institute for Fiscal Studies

Institute for Fiscal Studies Profile picture

Stay in touch and get notified when new unrolls are available from this author!

Read all threads

This Thread may be Removed Anytime!

PDF

Twitter may remove this content at anytime! Save it as PDF for later use!

Try unrolling a thread yourself!

how to unroll video
  1. Follow @ThreadReaderApp to mention us!

  2. From a Twitter thread mention us with a keyword "unroll"
@threadreaderapp unroll

Practice here first or read more on our help page!

More from @TheIFS

Oct 23
NEW: Access to Sure Start as a child reduced the likelihood of ending up in youth custody by a fifth.

THREAD on our new report, funded by @NuffieldFound, on Sure Start’s impact on crime and social care outcomes: [1/9]

ifs.org.uk/publications/e…
Established 25 years ago, Sure Start operated as a network of centres integrating services for families with young children under one roof, before being wound back since its peak in 2010.

Previous IFS work found it improved young people’s health and educational outcomes.

[2/9]
Access to a Sure Start centre during the early years reduced the probability of receiving a criminal conviction by 13%, and a custodial sentence in adolescence by 20%.

It did not have a major effect on less serious criminal outcomes: there was no effect on police cautions. [3/9] Chart shows effect of growing up near Sure Start on crime up to age 16, by percentage change in offending rates. Title states: "Living near a Sure Start centre before age 5 significantly reduced youth convictions and custodial sentences."
Read 9 tweets
Sep 27
NEW: Public sector pay has declined relative to the wider pay distribution, especially for higher earners.

@JCribbEcon @awmckendrick @m_dominguezp’s Green Budget chapter examines the pressures on public sector pay and the implications for recruitment & retention:

[THREAD: 1/11] Image
The new government has accepted in full the independent 2024 Pay Review Body recommendations, with average pay rises of 5.5%.

This is ahead of inflation, and close to private sector pay growth.

[2/11]
Pay in the public sector has evolved less favorably than in the private sector in recent years.

While private sector pay is 6% higher than it was in early 2019 in real terms, public sector pay is up by only 1%.

[3/11] Image
Read 11 tweets
Sep 19
NEW: Health-related benefit claims have risen substantially across England and Wales, with increases in mental health claims across all ages.

There is little evidence of similar trends in other countries.

THREAD on our new report on health-related benefits:

[1/7] Chart shows share of working-age population claiming selected health-related benefits: selected countries (indexed to 2019). Title states: "The rapid growth in health-related benefits seems to be largely a UK phenomenon."
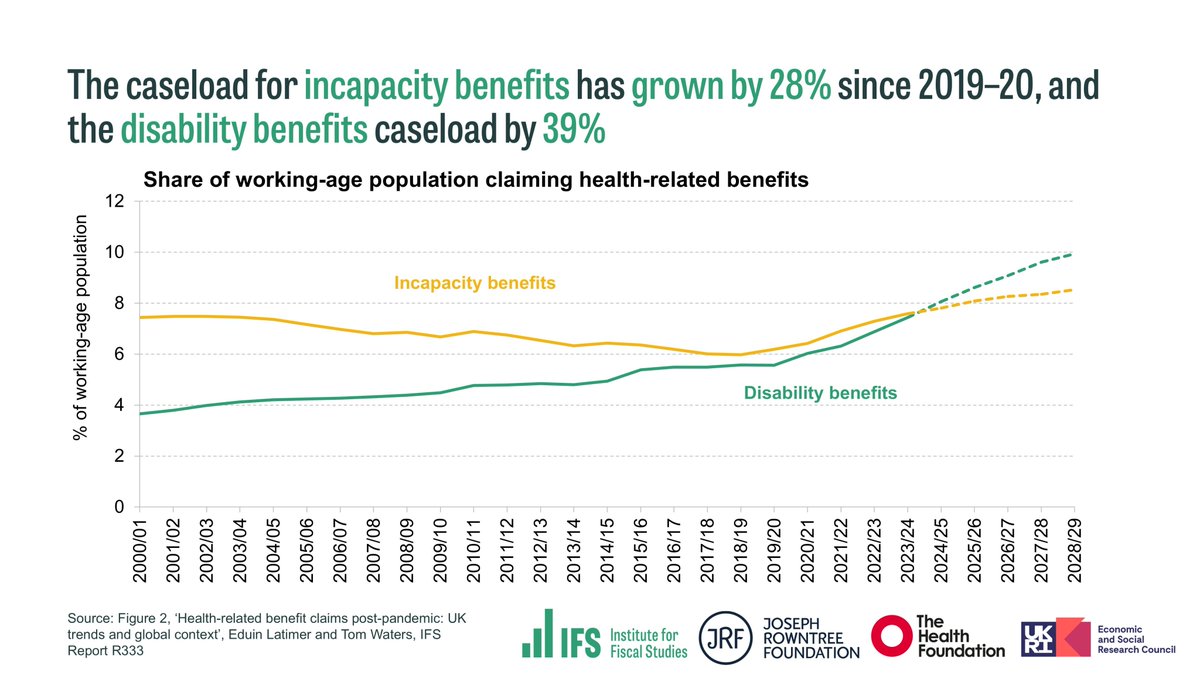
There has been rapid growth in the health-related benefits caseload since 2019. 1 in 10 working-age people in England & Wales now claim a health-related benefit.

@OBR_UK projects further growth of 19% for incapacity benefits & 41% for disability benefits from 2023 to 2028. [2/7] Chart shows share of working-age population claiming health-related benefits. Title states: "The caseload for incapacity benefits has grown by 28% since 2019–20, and the disability benefits caseload by 39%."
A higher caseload means higher spending. The UK now spends 1.7% of GDP on working-age health-related benefits.

This is up from 1.3% in 2019 but is still close to the OECD’s 2019 average of 1.6%. However, @OBR_UK forecasts that spending could rise to 2.1% of GDP by 2028.

[3/7] Chart shows sickness and disability benefits cash spending as a share of GDP: OECD countries (2019) and UK (2019, 2023, 2028). Title states: "Despite recent increases, the UK’s spending on working-age health-related benefits is still similar as a share of GDP to other comparable countries."
Read 7 tweets
Jul 25
NEW: Rising mortgage interest rates pushed 320,000 into poverty by December 2023, but only two-thirds of that will be captured by official statistics.

THREAD on Sam Ray-Chaudhuri, @TomWatersEcon & Tom Wernham’s @JRF_uk-funded living standards, poverty & inequality report:

[1/7] Charts show mortgagor absolute poverty rate (after deducting housing costs), under alternative interest rates. Title states: "Higher mortgage interest payments pushed 320,000 mortgagors into poverty by December 2023."
Mortgage interest rates have risen rapidly since June 2022.

These increases have not impacted all mortgagors, but those whose fixed period ended recently have faced much higher interest rates, which can increase payments by thousands of pounds per year.

[2/7] Chart shows average interest rate on new loans/remortgages (weighted by loan value). Title states: "Average mortgage interest rates for re-mortgagors had risen to more than 5% by December 2023."
Higher mortgage interest rates have caused poverty among mortgagors to rise from 7.9% to 9.3%, equivalent to 320,000 more people.

Official statistics use average interest rates to calculate mortgage payments, and so will only capture two-thirds (230,000) of this rise.

[3/7] Chart shows mortgagor absolute poverty rate (after deducting housing costs), under alternative interest rates. Title states: "Higher mortgage interest payments pushed 320,000 mortgagors into poverty by December 2023."
Read 7 tweets
Jun 24
STARTING NOW: @PJTheEconomist opens our IFS event analysing the 2024 General Election manifestos:

📺 Watch live here:

Ask questions here:
app.sli.do/event/9esN5Dd8…
- @PJTheEconomist: The "raw facts" on the public finances and funding for public services "are largely ignored by the two main parties in their manifestos."

"They have singularly failed even to acknowledge some of the most important issues and choices."
@PJTheEconomist Low growth, high debt and high interest payments means "to stop debt spiralling ever upwards we need to run primary surpluses."

"That means the government collecting more in tax and other revenues than it spends on everything apart from debt interest."

- @PJTheEconomist
Read 15 tweets
Jun 11
NEW: In advance of the Conservatives confirming their tax plans for the future today, we've assessed their record on tax policy in last 14 years.

THREAD on @HelenMiller_IFS, @StuartAdam_IFS and Bobbie Upton's new report, funded by @NuffieldFound @finan_fairness:

[1/11] Image
Tax revenue as a share of national income, at 36%, is higher now than at any point since 1948 and forecast to rise further.

The 2019-24 parliament saw the biggest rise in the tax take of any parliament in modern history.

[2/11] Image
The composition of revenue has changed.

Relative to 2010, more tax revenue is being raised from income tax, VAT, corporation tax and capital taxes. Less is being raised from fuel and tobacco duties and business rates.

[3/11] Image
Read 12 tweets

Did Thread Reader help you today?

Support us! We are indie developers!


This site is made by just two indie developers on a laptop doing marketing, support and development! Read more about the story.

Become a Premium Member ($3/month or $30/year) and get exclusive features!

Become Premium

Don't want to be a Premium member but still want to support us?

Make a small donation by buying us coffee ($5) or help with server cost ($10)

Donate via Paypal

Or Donate anonymously using crypto!

Ethereum

0xfe58350B80634f60Fa6Dc149a72b4DFbc17D341E copy

Bitcoin

3ATGMxNzCUFzxpMCHL5sWSt4DVtS8UqXpi copy

Thank you for your support!

Follow Us!

:(