Glen Peters Profile picture
Sep 9, 2021 17 tweets 6 min read Read on X
“[W]e scientists carry a big responsibility in not spreading the wrong messages” @jrockstrom

3/4 answered “yes” to this question, but Rockström said “no” in an interview with @MLiebreich

The question is ambiguous, so let’s unpack it a bit.

cleaningup.live/ep49-johan-roc…

1/ Image
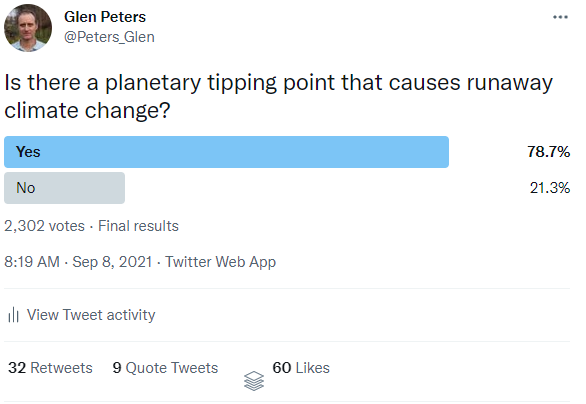
“[Y]ou're absolutely right, that nobody is suggesting that there is a planetary tipping point out there that causes runaway climate change” @jrockstrom

[I used this to make the question in the Twitter poll]

2/
That statement seems clear, but there are ambiguities:
* “a” or many?
* “planetary” or smaller scale?
* “runaway” or a new state?

These issues were common in yesterday’s discussion

3/
“[T]here are very few scientists… suggesting that 1.5°C is a tipping point threshold… the science today shows that at 2°C, we are at risk of triggering tipping points. Not that the planet would tip but we are at risk of triggering a significant number of tipping points.”
4/
“At 1.5°C, it's rather that the mainstream of science is that we will feel big impacts, we will have a lot of damage… three tipping points may be at risk already at 1.5°… I would say that 1.5 remains a kind of a high impact point” [not a tipping point threshold]
5/
“[I]t's important to understand that it's not like one system tipping, it is a myriad of different systems interacting…”

[And these systems are not really planetary scale, but subsystems like Arctic, Amazon, Greenland, North Atlantic, etc.]

6/ Image
“Nine out of these 15 systems are starting to show worrying signs, moving towards tipping points, not that they have crossed, but they show signs of either slowing down or higher variability” [quote simplified]
7/
“I mean, it's a battery of systems, and they all churn and work to regulate the state of the planet. So it isn't one button that suddenly releases the whole system, no.”
8/
“[T]he hothouse Earth paper … is essentially waved around as proof that we are tipping and that we're spiralling off… how do we as scientifically grounded people help to carry out this debate?”
@MLiebreich
pnas.org/content/115/33…
9/
Note the hothouse paper “uses the word 'could' 47 times 'might' eight times and 'may' 17 times & yet it gets trotted out as the definitive” @MLiebreich.

See also @richardabetts theconversation.com/hothouse-earth…
10/
“[T]he hothouse Earth paper showed that if… we reach 2°C … that the planet will probably, or very likely, by itself increase temperatures to a further 0.4 to 0.5°C”
11/
“[I]f you reach 2.5°C, we are at risk of triggering the next set of tipping point, which could lead to a cascade… that cascade could lead to a drift of warmer & warmer temperatures.”

[which sounds like a runaway to me, but I think a different state is meant]

12/ Image
“The impacts may come very far, the big let's call them catastrophic impacts, wouldn't play out until let's say 2,3,4 or 500 years in the future.”
13/
Back to the poll & first tweet.

It is hard to know what 75% of respondents are thinking when they say there is a tipping point that leads to runaway climate change. But clearly, there are communication issues.

[It is also a Twitter poll, not science, so don't confuse that]

14/
I think @jrockstrom is saying there are multiple interacting tipping points that could (at ~2°C) move the planet into a new state. Though, there are huge uncertainties.

Listen to the @MLCleaningUp podcast: cleaningup.live/ep49-johan-roc…
15/15
And, for a more detailed discussion of runaway and related issues, see this thread
For what it is worth, I would have answered "no" in my original poll. I think about this much the same as Pierre.

• • •

Missing some Tweet in this thread? You can try to force a refresh
 

Keep Current with Glen Peters

Glen Peters Profile picture

Stay in touch and get notified when new unrolls are available from this author!

Read all threads

This Thread may be Removed Anytime!

PDF

Twitter may remove this content at anytime! Save it as PDF for later use!

Try unrolling a thread yourself!

how to unroll video
  1. Follow @ThreadReaderApp to mention us!

  2. From a Twitter thread mention us with a keyword "unroll"
@threadreaderapp unroll

Practice here first or read more on our help page!

More from @Peters_Glen

Jun 12
Nitrous Oxide (N2O) is no laughing matter, atmospheric N2O has increased 25% due to human activities.

Today @gcarbonproject updates the Global Nitrous Oxide Budget, which helps us understand where the N2O comes from and where it goes.


1/ essd.copernicus.org/articles/16/25…
Image
According to IPCC AR6, N2O caused 0.1°C of the current warming of 1.1°C (not this figure is now higher).

This may sound small, but since N2O is long-lived (like CO2) & primarily comes from agriculture, that 0.1°C will only go up in the future.

2/ Image
There are many sources of N2O, over half of which are natural (soils).

Anthropogenic sources are dominated by agriculture (soils & manure management) & industry (chemicals).

The sink is due to photolysis & oxidation in the atmosphere.

3/ Image
Read 8 tweets
Jun 5
Greenhouse gas emissions are at record highs, again.

The only good news is that Ozone Depleting Substances (ODS) regulating under the Montreal Protocol have declined substantially in the last decades.

But what does all this mean for climate?


1/ 🧵 essd.copernicus.org/articles/16/26…
Image
Record high emissions means record high radiative forcing.

We have you covered, we also include aerosols (SO2, etc) & have done so for decades. Also shipping!

Short-lived aerosols are important, but should not distract from the drivers of change: greenhouse gas emissions!

2/ Image
Most of the energy put into the system ends in the ocean (90%), so the Ocean Heat Content (OHC) has been increasing along with emissions and radiative forcing.

This also means the Earth Energy Imbalance is also increasing.

3/ Image
Read 8 tweets
May 9
"Implemented policies result in projected emissions that lead to warming of 3.2°C, with a range of 2.2°C to 3.5°C (medium confidence)"

According to the landmark, widely reported IPCC Synthesis Report published in 2023.


1/ ipcc.ch/report/ar6/syr/
Image
If you are surprised by this figure, where the median is 2.5°C (not 3.2°C), then I am curious why you think scientists are so optimistic...

The survey reflects more or less what scientists have been saying for years?


2/ theguardian.com/environment/ar…
Image
This question is ambiguous: "How high above pre-industrial levels do you think average global temperature will rise between now and 2100?"
* ...pre-industrial... between "now and 2100"?
* Where we are currently heading or where we could head? This is largely a policy question?
3/
Read 10 tweets
Apr 12
There is a very strong linear relationship between atmospheric CO2 (concentration) and cumulative CO2 emissions.

In the last days, quite a few have been commenting there are feedbacks kicking in.

A thread...

1/ Image
If atmospheric CO2 is proportional to cumulative CO2 emissions, then the annual change in atmospheric CO2 is proportional to annual CO2 emissions.

The ratio of the two is the 'airborne fraction', which is rather constant. Maybe a slight increase in trend lately, maybe...

2/ Image
Since emissions have leveled out in the last decade, one would expect therefore that the atmospheric increase has leveled out.

The concentration data is noisy, and it has leveled out or not depending on how it is smoothed! (look at last 10 years).

3/ Image
Read 8 tweets
Apr 9
Is the atmospheric growth rate of CO2 slowing down?

Total CO2 emissions have gone from 2%/yr growth (2000s) to 0%/yr (2010s).

Do we see that change in the atmosphere?

It is hard to answer 🧵


1/ rdcu.be/buifD
Image
I can make this figure incredibly complex by adjusting for ENSO (red dots and line).

We know the response of atmospheric CO2 to El Niño is lagged. This figure shows a 9 month lag, as used by Betts & Jones in their projection

But, 2023 is a La Niña?

2/ metoffice.gov.uk/research/clima…
Image
The same figure with a three month lag says 2023 is a El Niño.

In either case, adjusting the growth rate for ENSO makes it look like the atmospheric CO2 growth rate is maintained, and not slowing down.

This is worrying. It should be slowing down...

3/ Image
Read 8 tweets
Dec 15, 2023
One of the key arguments that Norway uses to continue oil & gas developments, is that under BAU it is expected that oil & gas production will decline in line with <2°C scenarios, even with continued investment.

Let's look closer at these projections & reality...

1/ Image
Here is the projections from the 2003 report from the petroleum agency.

In reality (tweet 1) there was a dip around 2010, but production is now up around 250 million cubic again.

The forecast was totally & utterly WRONG!

2/ Image
In 2011 there was a forecast for an increase in production to 2020, but then a decline. This is probably since they started to put the Johan Sverdrup field on the books.

The increase in production was way too low, again, they got it wrong.

3/ Image
Read 9 tweets

Did Thread Reader help you today?

Support us! We are indie developers!


This site is made by just two indie developers on a laptop doing marketing, support and development! Read more about the story.

Become a Premium Member ($3/month or $30/year) and get exclusive features!

Become Premium

Don't want to be a Premium member but still want to support us?

Make a small donation by buying us coffee ($5) or help with server cost ($10)

Donate via Paypal

Or Donate anonymously using crypto!

Ethereum

0xfe58350B80634f60Fa6Dc149a72b4DFbc17D341E copy

Bitcoin

3ATGMxNzCUFzxpMCHL5sWSt4DVtS8UqXpi copy

Thank you for your support!

Follow Us!

:(