How well are vaccines and boosters really protecting against COVID-19 deaths?
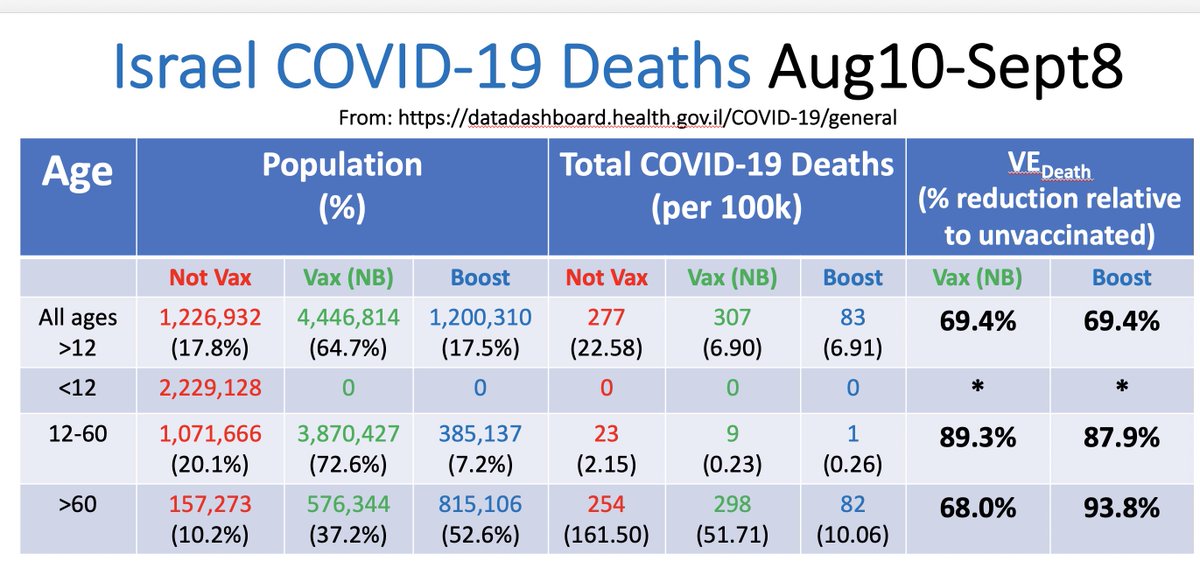
Israel MoH publicly posted daily COVID-19 death data split by unvaccinated, boosted, and vaccinated-not-boosted from Aug10-Sept8
Here are results of my analysis of these data
1/n
Summing over all days, it is not promising to see so many COVID-19 deaths in vaccinated/boosted groups.
But by now we know better than to draw conclusions from raw counts, right? 2/n
The Israeli MoH dashboard provides enough information to infer total proportion of population unvaccinated, boosted, or vaccinated-by-not-boosted, so we can compute normalized COVID-19 death rates in these groups.
3/n
From these, we can compute overall estimates of vaccine/booster effectiveness(VE) in preventing COVID-19 deaths relative to unvaccinated.
These overall VE estimates are VERY low; some might infer from this the vaccines and boosters are NOT protecting vs. COVID-19 deaths. 4/n
But don’t forget Simpson’s Paradox.
We see much lower vaccination/booster rates in the young, who also have MUCH lower rate of COVID-19 death.
This confounding of age might distort the overall VE estimates, so let’s compute separate estiamtes for each age group. 5/n
VE estimates by age are much higher than overall, showing indeed there was a strong Simpson effect.
Before interpreting these results, however, we need to consider one other thing: Do the <60yr data include children and, if so, should we pull them out into their own group? 6/n
Given the total counts for all ages sum to >9.1m, the total Israeli population, it is clear children are among the <60yr group, and we can infer the number <12yr from the MoH data.
They are unvaccinated, and unlikely to comprise any of the 23 COVID-19 deaths. 7/n
Splitting children out dramatically affects the VE estimates for the <60 group as well as overall.
It is CRUCIAL to separate children out when looking at vaccine effectiveness, since they cannot be vaccinated and have the lowest risk of advanced COVID-19 events. 8/n
Now consider the results.
For older group, we see vaccines reduced risk of COVID-19 deaths during this time period without boosters, but boosters clearly increased level of protection.
This is consistent with published papers showing early results from boosting. 9/n
For younger group, we see high protection vs. COVID-19 deaths from vaccines, and in these data no evidence boosters improve protection.
However, given only 7% boosted and not much time passed, it is possible that future data will show a booster benefit for young adults.
10/n
Repeating this analysis on “critical COVID-19 disease”, we see similar results.
The vaccines protect against critical disease, with older adults showing potential waning of efficacy improved by boosters, & younger adults showing strong protection irrespective of booster.
11/n
Two key caveats in these data: 1. It is not clear how this MoH data set counted individuals partially vaccinated with a single dose. 2. Also, MoH did not separate previously infected, who are either unvaccinated or partially vaccinated, which could attenuate VE estimates.
12/n
While informative, this analysis is limited given lack of access to important confounders other than age; Israeli research groups w/ access to more complete data can do more rigorous analyses.
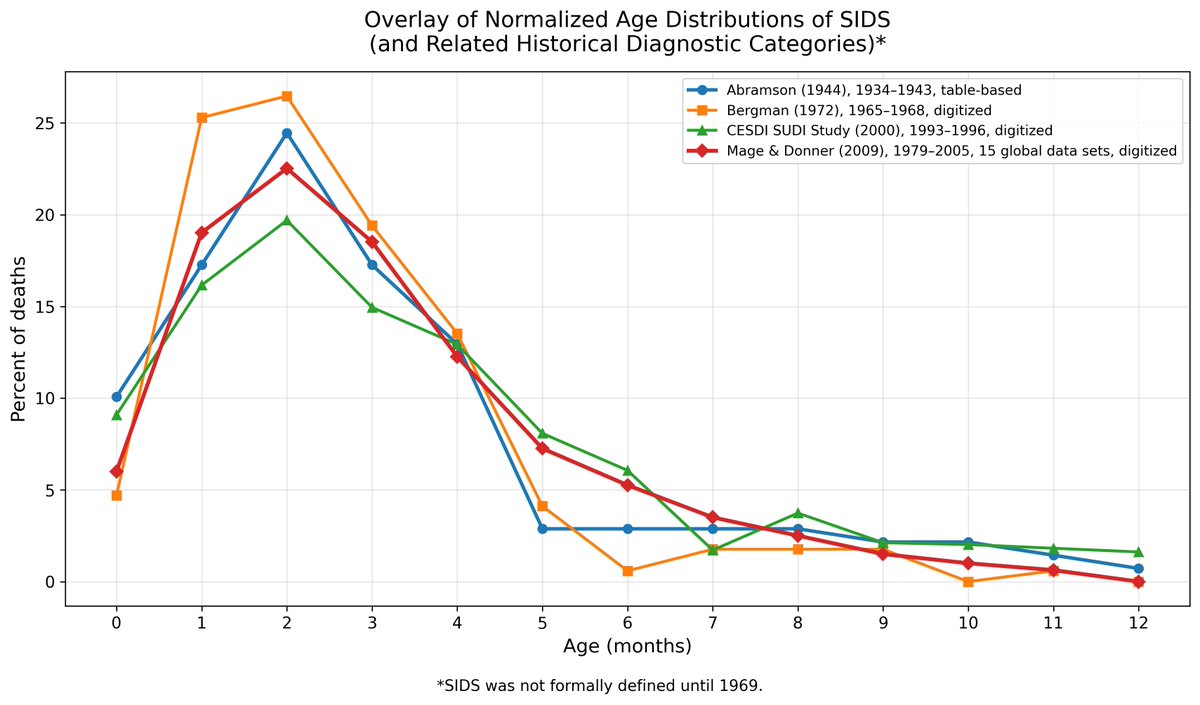
It has long been known that SIDS follows a characteristic background age distribution: risk rises over the first couple of months to a mode at 2 months, a median around 3 months, then declines sharply through 12 months.
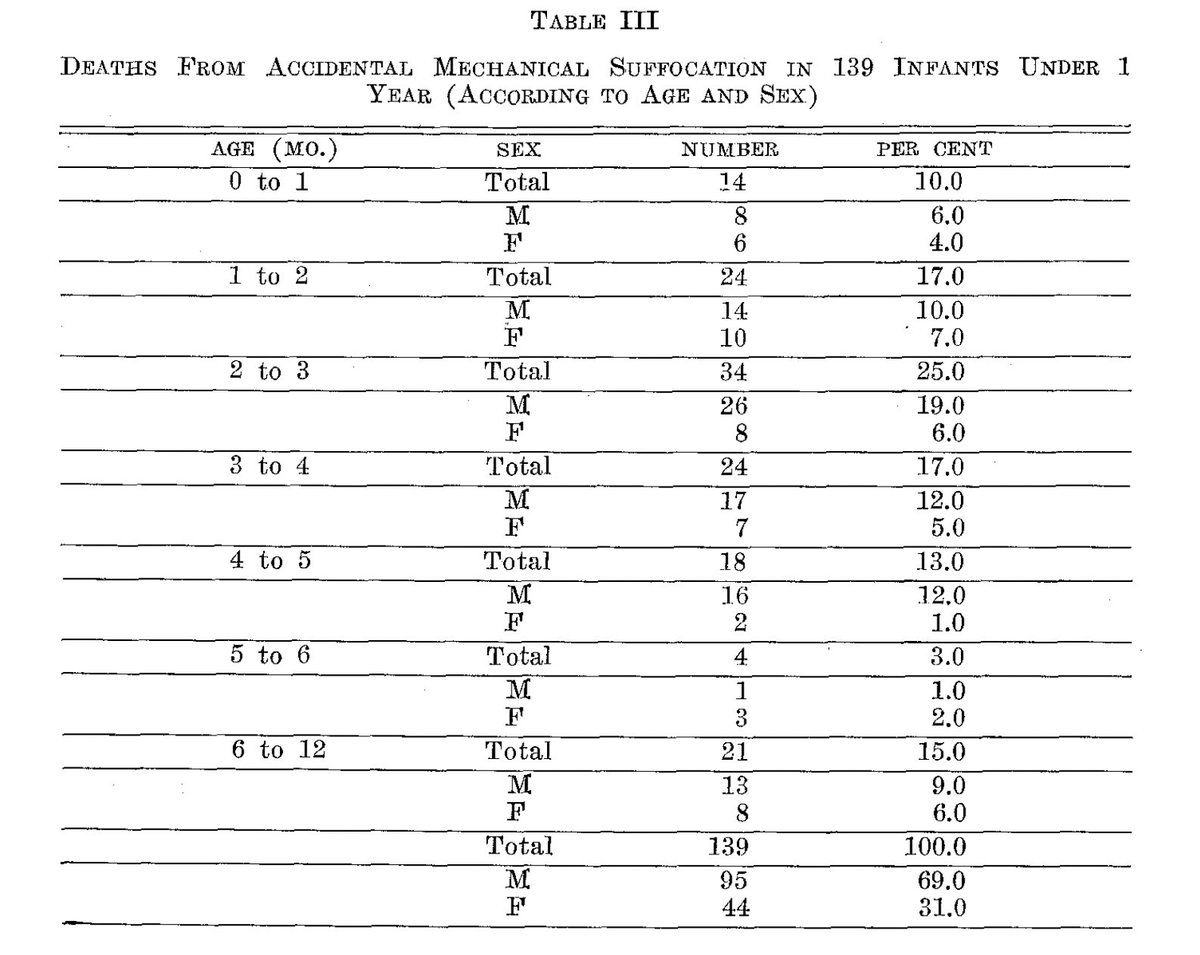
SIDS wasn't formally defined until 1969 — but this same pattern shows up in related infant-death categories going much further back. Abramson (1944) presented a table with the age distribution of accidental mechanical suffocation in infancy in New York from 1934–1943, well before any routine infant vaccination. This table displays this characteristic pattern.
To see how stable this pattern is, I pulled the data from the Abramson table and digitized the figures from three later SIDS studies, then normalized each to an annual age distribution summing to 100% to put them on a common scale:
1965–1968, USA (Washington)
1993–1996, UK
1979–2005, pooled across 15 global datasets
Overlaying all four (plot below), the age distribution has stayed remarkably consistent across many decades and completely different vaccination eras — from before routine infant vaccines existed, in early days of vaccination, through the modern schedule.
That's rather inconvenient for the claim that the SIDS peak at 2–4 months must be vaccine-caused simply because vaccines are given around that age. The peak predates the vaccines and persists unchanged regardless of them.
It also drives home why adjusting for age confounding is essential in any analysis of whether SIDS risk rises after vaccination. With a background curve this steep, a method that doesn't adjust for age will conclude "vaccine harm" no matter what — even when there is no vaccine effect at all. That's exactly what my simulation studies found: a 100% false-positive rate under the true null when age went unadjusted.
Full links to every paper, the source tables and figures, the extracted data, the normalized distributions, and everything needed to reproduce these plots are in the posts below and in the GitHub repo linked at the end of the thread.
Here is the first paper, Abramson (1944): jpeds.com/article/S0022-…
It summarizes 139 cases of "accidental mechanical suffocation deaths in infancy." Table III gives the age distribution of these cases, which I used to generate the curve in the plot. For the 21 cases the table groups into the 6–12 month range, I distributed them across the individual months as 4, 4, 4, 3, 3, 2, and 1, respectively.
This paper wasn't modeling SIDS as such — the category and definition did not exist yet.
But it was the first in a series of papers that led to the recognition of a distinct category of unexplained infant crib death, work that culminated in the formal definition of SIDS in 1969. I'll trace that lineage in the next post.
The age distribution on the previous page was of deaths the authors classified as "accidental mechanical suffocation deaths in infancy." But that classification was itself contested from early on.
Wooley (1945) sciencedirect.com/science/articl… responded directly to Abramson, pointing out that suffocation was presumed, not confirmed — many of these infants had simply died in their sleep with no explanation and were assumed to have suffocated. It was one of the earliest explicit arguments that infant deaths certified as mechanical suffocation likely belonged to a broader category of sudden unexplained infant death, and that attributing them all to suffocation was probably wrong.
The rest of the lineage followed:
Werne & Garrow (1953) pmc.ncbi.nlm.nih.gov/articles/PMC19… published one of the first systematic pathological studies of infants found dead unexpectedly, emphasizing that many deaths remained unexplained even after autopsy.
Adelson & Kinney (1956) pubmed.ncbi.nlm.nih.gov/13322513/ developed the concept of "sudden and unexpected death in infancy," explicitly separating these deaths from obvious accidental suffocation (see quote below)
At the 1969 Seattle conference, Beckwith proposed the term Sudden Infant Death Syndrome — the first formal definition of the syndrome, later set out in the peer-reviewed Beckwith (1973): pubmed.ncbi.nlm.nih.gov/4351768/
So the Abramson (1944) age distribution is not irrelevant to SIDS. Contemporaries recognized at the time that many of these "suffocation" deaths were the very same sudden, unexplained infant deaths that would later be named SIDS — which is why the curve looks the way it does, and why it belongs in this overlay.
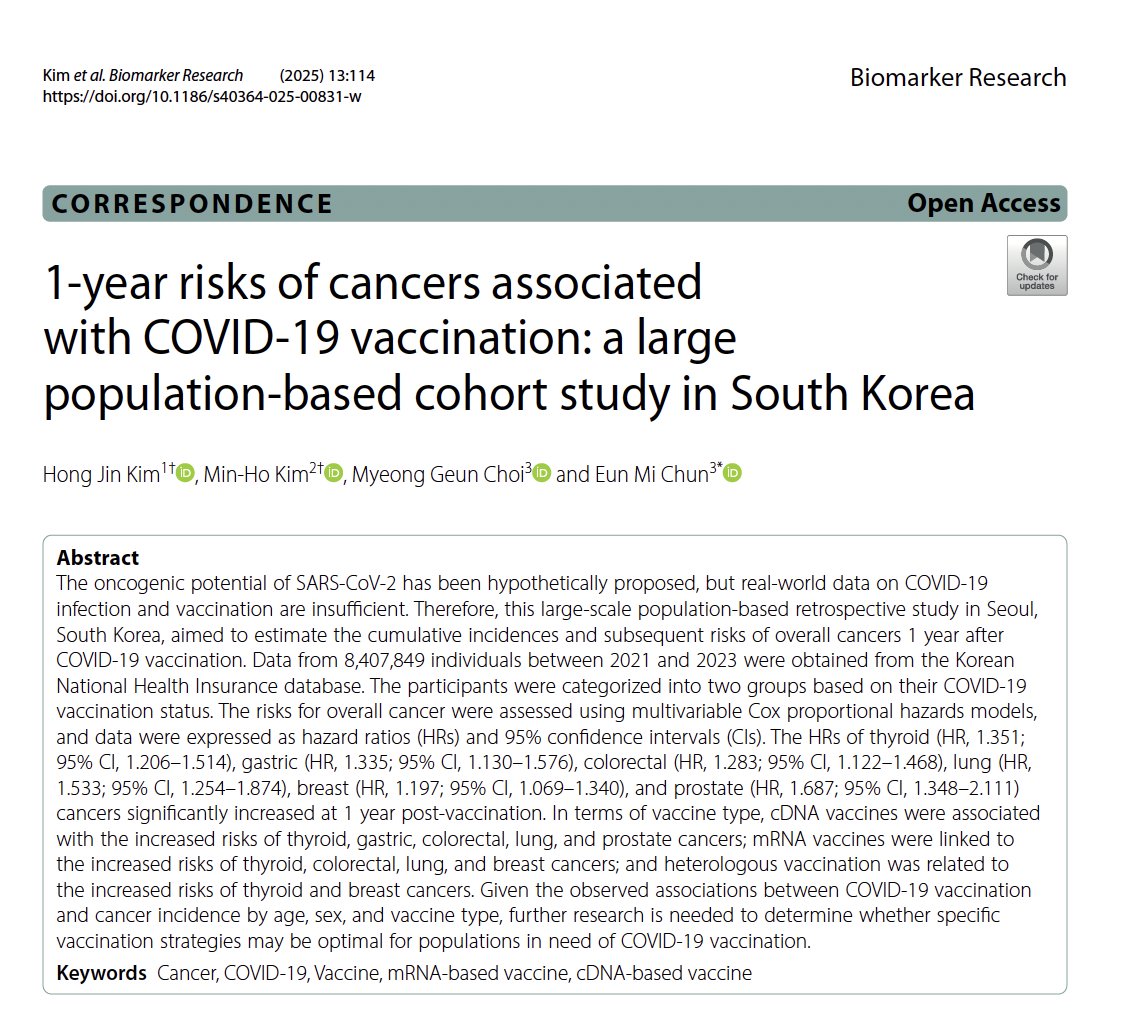
A large Korean study just published in Biomarker Research analyzed cancer diagnosis by COVID-19 vaccination status in 1yr following primary or booster doses of vaccines.
They report more diagnoses after vaccination after primary doses, but a closer look shows the patterns are inconsistent, biologically implausible, and best explained by surveillance bias/reverse causality, not vaccine causality. 🧵
The study used Korean National Health Insurance data (2021–23), assessing whether cancer diagnoses were greater in the year after vaccination vs. unvaccinated controls.
The study compared 2.38M primary vaccinated vs. 595k unvaccinated, propensity score matched on age (<65yrs, 65-74yrs, 75yrs+), sex, SES, comorbidities (0, 1, 2+), and infection history.
It also compared 711k boosted vs. 356k non-boosted, also matched.
Outcomes were stratified by age, sex, and vaccine type (mRNA vaccines and cDNA vaccines), and also presented for 1m, 3m, 6m, 9m and 12m after vaccination.
The study looked at both overall cancer diagnoses and incidence of many individual cancer types.
Key Findings:
Primary vaccination HR=1.27 → 27% more cancer diagnoses within 1 year of primary vaccination vs. unvaccinated.
During the recent Senate hearings, participants highlighted a Henry Ford Health System study, billed in a forthcoming documentary as ‘An Inconvenient Study,’ and portrayed it as conclusive proof that vaccines elevate childhood chronic-disease risk, claiming it was concealed by researchers fearing retaliation.
Drawing on the Senate hearings, public reports, and other online materials, I reconstructed the study details and in this post summarize some of my main findings and concerns. These overlap with Dr. Scott’s observations, with several additional points of my own.
Study at a glance. The cohort includes ~18,500 children from the Henry Ford Health System (Michigan), born 2000–2016, comparing ~16,500 vaccinated to ~2,000 unvaccinated on diagnoses of multiple chronic conditions, as documented in the Ford electronic medical records.
Reported results. The overall rate of “any selected chronic disease” was about 2.5× higher in vaccinated children. For various individual or grouped outcomes, many estimates were statistically significant and fell in the 3.0–6.0×range, leading the authors to conclude that “vaccine exposure in children was associated with increased risk of developing a chronic health disorder.”
Why causal claims aren’t warranted. The dataset is valuable, but the study has major limitations that compromise the ability to make strong conclusions. 1. Baseline imbalance/confounding: large differences between groups, with key potential confounders not taken into account. 2. Ascertainment bias from health-care utilization differences: Major differences in encounter rates likely inflate detection in one group. 3. Age-related ascertainment bias from unequal follow-up: Vaccinated and unvaccinated have very different follow-up distributions, affecting who ages into typical diagnosis windows.
Follow-up is the critical limitation of this study. Median follow-up is ~1.2 years (unvaccinated) versus ~2.7 years (vaccinated): far too short, especially for many of these conditions often first identified around ages 5–10 years once children are in school.
This severely limits the study’s ability to assess whether vaccine exposure increases risk of developing chronic disorders over childhood, regardless of statistical significance in the reported comparisons.
I’ll delve into these points in more detail below.
First a brief summary of the study and results:
Design and cohorts. The study follows ~18,500 children in the Henry Ford Health System (Michigan), born 2000–2016. About 2,000 were completely unvaccinated and ~16,500 received at least one vaccine(ranging from 2 to 22 doses).
Analysis. The study compares vaccinated and unvaccinated children using two approaches: 1. Incidence Rate Ratios (IRR): Poisson models of raw diagnosis counts per person-time, without confounder adjustment. 2. Hazard Ratios (HR): Cox time-to-event models, reported both unadjusted and adjusted for sex, race, gestational age, birth weight, respiratory trauma at birth, and birth trauma.
Key Results (as reported). Compared with never-vaccinated, vaccinated children show higher incidence for chronic conditions 2.5×, and for specific categories asthma 4.3×, atopic disease 3.0×, autoimmune 6.0×, chronic ear infection 5.7x and anaphylaxis 8.9x.
No difference was seen for eczema or peanut allergy, cancer, food allergy motor disability, motor disability, mental health disorders or seizures.
The composite category "neurodevelopmental disorders" had 5.5×; and within that composite: developmental delay 3.3×, motor disability 2.9×, speech disorder 4.5×, but notably not autism.
Autism is the outlier: adjusted HR ≈ 0.6 (no evidence of increased autism). There were few autistic diagnoses in this cohort (which when you look at how short follow up times are for most children, is unsurprising). Aaron Siri downplayed this in his report by invoking misclassification as ADHD, but this is speculative and unconvincing on its face.
I appreciate that @joshg99 has unblocked me, allowing me to respond to his thoughtful comments on my previous post discussing his recent preprint. The paper reports a potential safety signal for pregnancy loss among women vaccinated between 8–13 weeks of gestation.
Before responding to specific points, I want to better summarize and explain the points I made in my analysis, and then will refer back to these in my responses.
First, I want to emphasize that there is much to appreciate about this paper:
1. It uses a large, high-quality healthcare dataset that is far superior to passive surveillance systems like VAERS, which lack control groups and suffer from heterogeneous reporting biases. 2. The modeling is careful and the writing is clear. 3. The authors responsibly acknowledge that their findings are not causal and require further validation.
That said, the paper’s central conclusion, a potential safety signal, is driven almost entirely by a small, highly selected subgroup: women receiving their first COVID vaccine dose between gestational weeks 8 and 13. There is no indication this window was pre-specified in a protocol or analysis plan.
The authors also suggest a safety signal for third doses in the 8–13 week window. However, their own observed-minus-expected plot shows this appears to be concentrated in a single gestational week (likely week 10, see below), raising questions about the robustness of that result.
To fully evaluate the strength and validity of the conclusions, several additional analyses are essential.
These fall into four main areas, which I will next summarize.
1. Calendar Time Confounding
The pivotal 1st dose 8–13 wk cohort includes just 1.9% of pregnancies and 1.8% of pregnancy losses, and >90% of this group had last menstrual periods (LMPs) between Oct 2020 and Jan 2021: i.e., immediately after vaccine rollout.
To assess potential confounding by calendar time:
1. The LMP distribution is only shown for the pivotal COVID 1st dose 8–13 wk group. It should also be shown for all of the other vaccination cohorts, especially the flu 8–13 wk group used as a control.
2. The authors should present observed-minus-expected pregnancy loss results for unvaccinated women, both overall (for completeness and transparency) and for subcohorts with LMP distributions matched to each vaccinated group (e.g., 1st dose 8–13 wk, 3rd dose 8–13 wk, 14–27 wk groups, flu 8–13 wk, etc.)
3. It would also be informative to present observed-minus-expected pregnancy loss for unvaccinated women as a function of LMP date (monthly?) throughout the pandemic, which would be a nice descriptive analysis of potential calendar time confounding.
Differences in timing could influence results through factors like lockdowns, pandemic wave exposures, and healthcare access and utilization.
Showing raw and observed-minus-expected outcomes for matched unvaccinated cohorts would help clarify whether calendar time is a source of bias. Differences would warrant caution in interpretation; consistency would increase confidence.
2. Impact of COVID Infections on Pregnancy Loss
The authors presented results summarizing observed-minus-expected pregnancy loss for women experiencing covid infections during wk8-13 or wk14-27 of their pregnancies, but they did not present the same results for women experiencing covid infections during late pregnancy (wk28+).
This is important to consider, given that the authors point out that many of the pregnancy losses in the pivotal 8-13wk 1st dose group occurred late and that these women vaccinated during early pregnancy soon after rollout would have specifically been exposed to the Delta covid wave during their late pregnancy.
Recommended additions: 1. Present pregnancy loss rates after 28 weeks for women with COVID infections during pregnancy. 2. Include 2×2 tables (pregnancy loss: yes/no × COVID infection during pregnancy: yes/no) for each cohort, particularly the 8–13 wk COVID-vaccinated groups. If there is no association, it would suggest Delta infections were not a primary factor explaining excess late losses.
A new preprint has posted online assessing potential safety signals for pregnancy loss after mRNA vaccination during pregnancy using Israeli electronic health records (EHR data), with first author @joshg99 and senior author @RetsefL (newly appointed member of CDC's ACIP).
Their primary conclusions were that pregnant women vaccinated for COVID in the second half of the first trimester (wk8-13) had greater observed pregnancy loss rates than expected from the pre-pandemic regression model computable from EHR.
They also found that pregnant women vaccinated for COVID in the second trimester (wk14-27) and pregnant women vaccinated for flu from wk8-13 or wk14-27 had significantly lower-than-expected observed pregnancy loss rates during the pandemic,
and that women vaccinated for COVID or flu before pregnancy had slightly lower-than-expected pregnancy loss rates. They attribute these results to residual confounding (i.e. healthy vaccinee effect HVE)
The paper is exceptionally well written and introduces a rigorous approach for identifying potential safety signals from EHR data, an active reporting approach that avoids the key limitations of passive reporting systems (like VAERs in USA, AEFI in Israel): (1) reporting bias and (2) the lack of control group.(poorly understood limitations of these systems that I have harped upon ad nauseum on social media)
However, the paper has some key omissions that limit the ability to carefully interpret the results, including: 1. Failure to investigate and fully account for pandemic-related calendar time varying confounders. 2. Lack of assessment of whether women remaining unvaccinated throughout pregnancy during the pandemic had higher- or lower-than expected pregnancy loss. 3. No assessment of whether COVID-19 infections later in pregnancy were factors in post-vaccination pregnancy losses, especially for the primary cohorts. 4. Incomplete summary of results of vaccination before pregnancy 5. Lack of assessment of whether women vaccinated before week 8 of their pregnancy had higher- or lower-than-expected pregnancy loss. 6. Lack of summary of which type of pregnancy loss outcomes (spontaneous abortion, induced abortion, stillbirth) dominated the events for each modeled cohort.
The authors’ observed-expected analysis approach could be readily applied to perform each of these suggested analyses.
Given that the primary vaccinated subgroups driving their conclusions are very small (e.g. 1st dose wk8-13 cohort being 1.9% of pregnancies and 1.8% of pregnancy losses) and with pregnancies during specific times during the pandemic (e.g. ~90% of 1st dose wk8-13 having last menstrual period (LMP) between 10/2020 and 1/2021), there is concern for remaining residual confounding in these cohorts, from pandemic-related or medically-related confounders, and these analyses could shed more light on whether this concern is significant or not.
The inclusion of these results would provide a more complete and transparent picture of potential COVID vaccine effects on pregnancy loss.
It is not valid to dismiss any results showing lower-than-expected pregnancy loss in vaccinated subgroups as driven by residual confounding (by claiming HVE) without acknowledging that the higher-than-expected pregnancy loss in one small vaccinated subgroup (covid vaccinated wk8-13) could similarly be driven by residual confounding.
This thread will walk through the key details of their study and results, and elaborate some on these concerns.
This paper (see link below) sets out to investigate whether there is a potential safety signal for pregnancy loss when vaccinated pregnant women for COVID-19 during the pandemic.
Their study is based on electronic health record (EHR) data from Maccabbi, one of four HMO’s in Israel, accounting for 26% of the Israeli population.
As mentioned above, this qualifies as an active reporting system study of vaccine safety that is much more rigorous than passive reporting systems (e.g. VAERs in USA or AEFI in Israel), since the EHR contains events for control groups and does not have the same highly variable reporting bias.
Their endpoint of interest was pregnancy loss, which includes 3 outcomes: 1. Spontaneous abortion 2. Induced abortion (elective or medically-indicated) 3. Stillbirth.
All of their analysis were done on the pooled endpoint, not split out by each outcome.
They mentioned that the EHR lacked evidence for whether induced abortions were elective or medically indicated.
Cleveland Clinic researchers have posted a preprint on medRxiv assessing the flu infection rate among employees who received the flu vaccine relative to those who did not receive the flu vaccine.
Using a Cox regression model while adjusting for age, sex, clinical nursing job, and location (but not propensity to test for flu), they found the vaccinated had a hazard ratio of 1.27, concluding the vaccinated had a 27% higher risk of infection and thus concluding -27% negative vaccine effectiveness.
As in their previous studies on COVID-19 vaccines (cited by many as evidence of negative vaccine effectiveness), this study suffers the same fatal flaw of testing bias, with vaccinated significantly more likely to test for flu than unvaccinated, 27% more likely in fact.
They try to dismiss this concern by claiming the test positivity is equivalent between vaccinated and unvaccinated based on a strange and poorly justified linear regression analysis.
But when looking at the data in their figures 1-2 and summarizing on an appropriate scale, it is clear that the test positivity is substantially lower in vaccinated than unvaccinated (20% lower), so the testing bias cannot be dismissed, and suggesting the increased testing in vaccination is a bias that can explain their HR=1.27 effect, and not indication of higher infection rates.
Thus, their conclusion of -27% negative vaccine effectiveness is not supported by their data.
They compute the daily testing rate in vaccinated and unvaccinated and plotted the ratio of vaccinated/unvaccinated in Table 1a, from which they acknowledge the vaccinated test at a significantly higher rate than unvaccinated.
It is to their credit they acknowledge this.
The increased testing could represent a bias that compromises their conclusion of vaccine effectiveness, or it could be an indication of higher infections, since a 27% higher testing rate could simply be an indicator of 27% higher infection rates.
The test positivity (% of flu tests positive) can be used to assess this possibility.
If the higher confirmed infection rate were simply a function of testing bias, then the testing positivity would be lower in vaccinated than unvaccinated, indicating overtesting, and thus a ratio of testing positivity in vaccinated/unvaccinated would be less than 1.
If the higher testing rate were simply from higher infection rates and not testing bias, we'd expect the testing positivity to be equivalent between vaccinated and unvaccianted, with a ratio near 1.