George S. Pepper Professor of Public Health & Preventive Medicine; Biostats, Stats & AI; lifelong learner & truth seeker; Views are my own, not my employer's
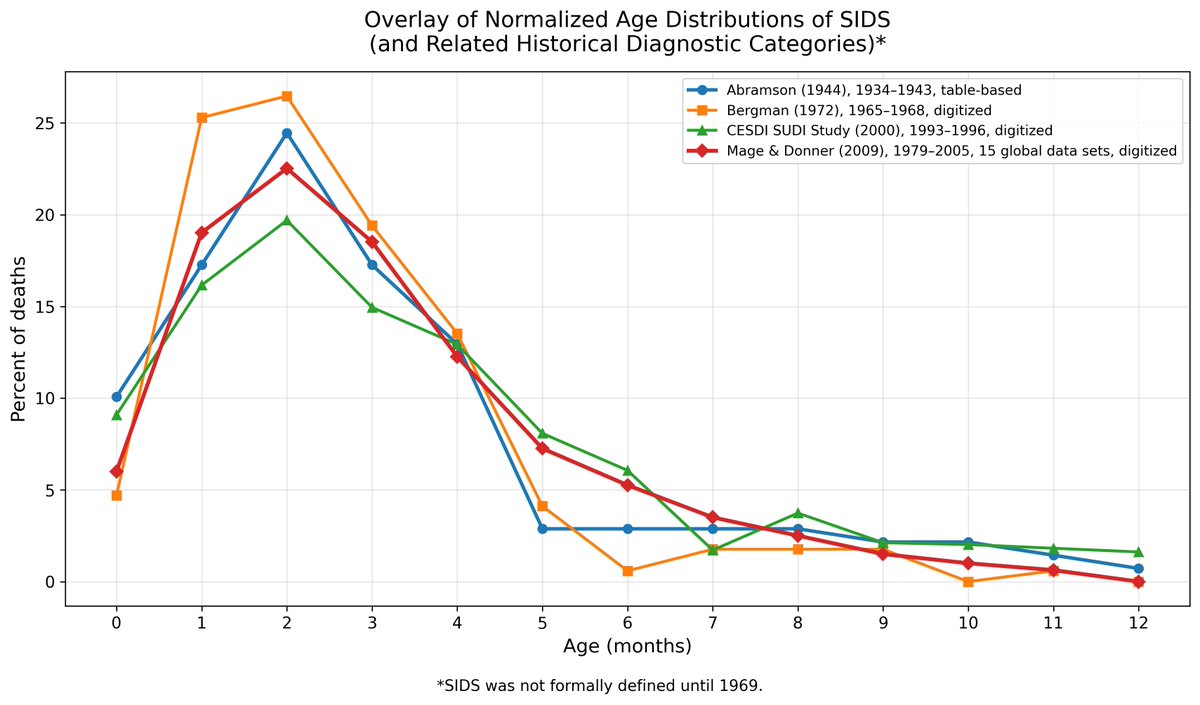 Here is the first paper, Abramson (1944): jpeds.com/article/S0022-…
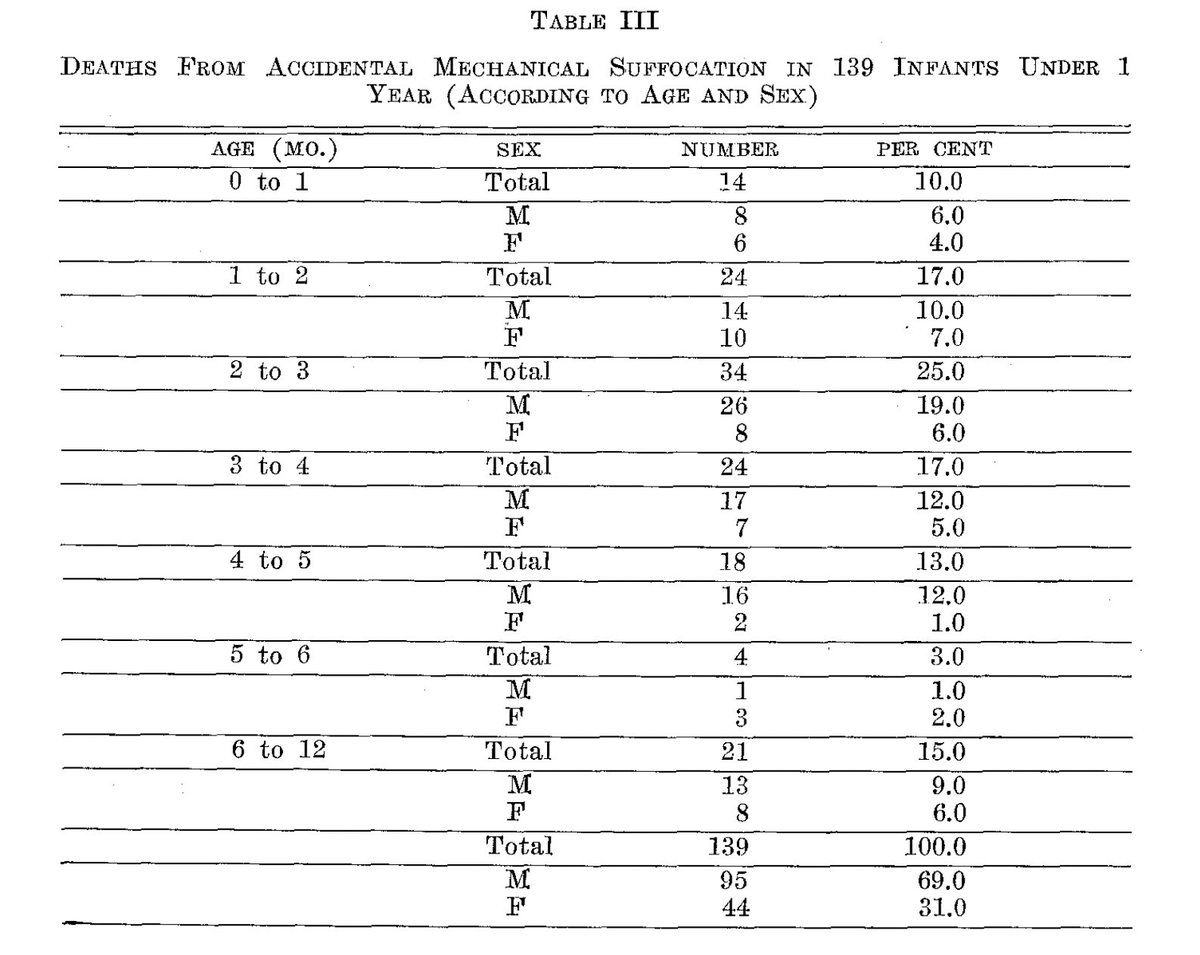

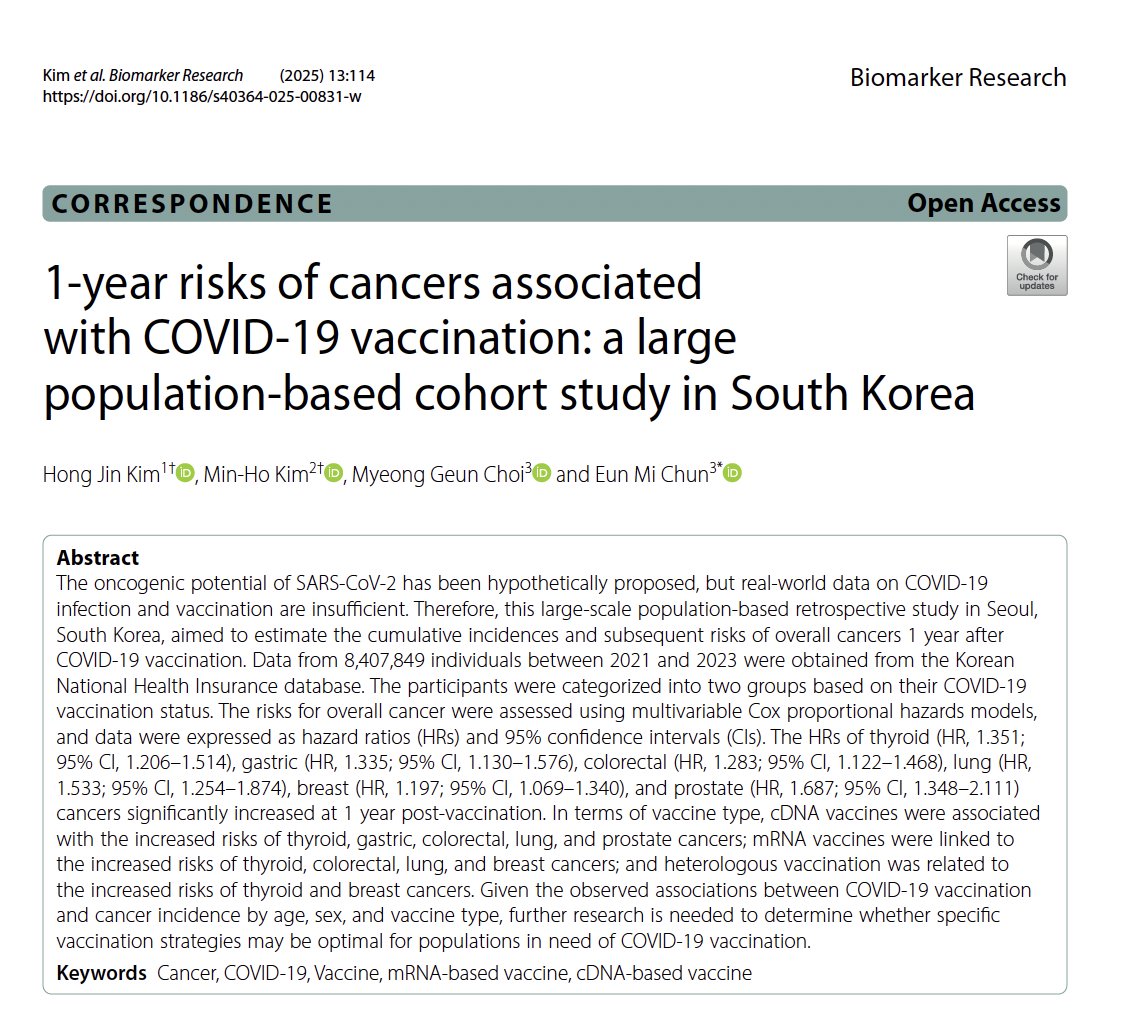 The study used Korean National Health Insurance data (2021–23), assessing whether cancer diagnoses were greater in the year after vaccination vs. unvaccinated controls.
 First a brief summary of the study and results:
 1. Calendar Time Confounding
 This paper (see link below) sets out to investigate whether there is a potential safety signal for pregnancy loss when vaccinated pregnant women for COVID-19 during the pandemic.
 They compute the daily testing rate in vaccinated and unvaccinated and plotted the ratio of vaccinated/unvaccinated in Table 1a, from which they acknowledge the vaccinated test at a significantly higher rate than unvaccinated.


 Let's do an exercise to show how their study flaw can generate false associations and invalid conclusions.

 The primary question of this study is whether fluoride exposure from water is linked with lower cognition, which in this study involves analyzing potential associations between urinary fluoride levels at 5yrs and and cognitive scores at 5yrs and 10yrs, urinary fluoride levels at 10yrs with cognitive scores at 10yrs, and prenatal urinary fluoride levels at 8wks gestation with cognitive scores at 5yrs and 10yrs.
  There are other papers looking at CFR/IFR, but none as expansive or rigorous as this one.

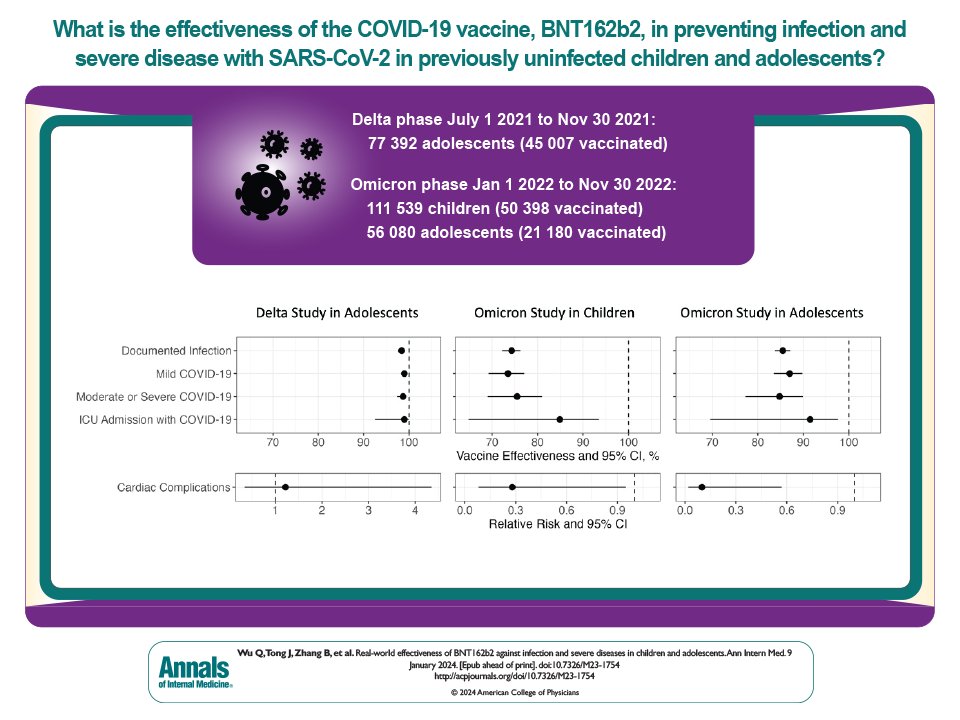
 These data were from the RECOVER network including 21 pediatric hospital networks from all over the USA, including 112,590 adolescents during the Delta period, and 84,735 adolescents and 188,894 children during the early Omicron period
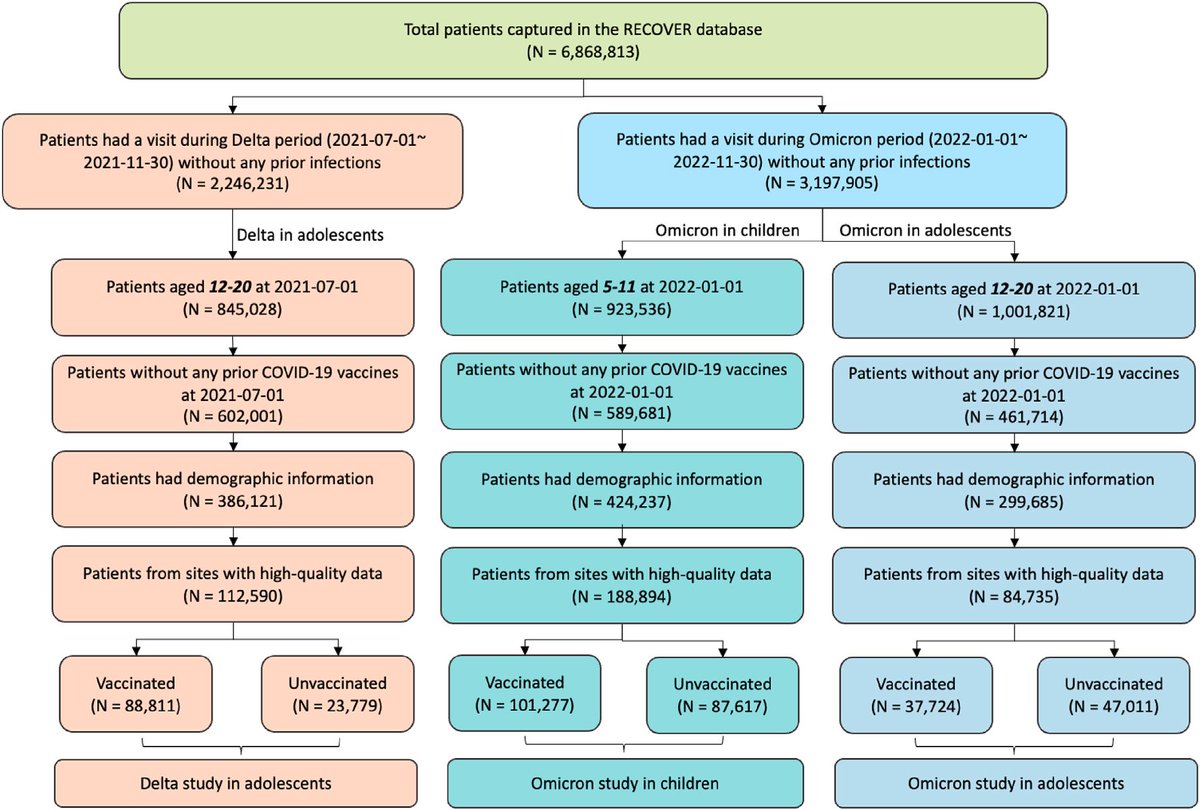

 SARS-CoV-2 vaccines have been shown by many studies to greatly reduce the morbidity and mortality from COVID-19 during the pandemic, especially during 2021-2022. mRNA vaccines have been the predominate type used in many places around the world, and has consistently shown the highest effectiveness in most studies.

 First, I am not sure why this article is classified as “original research” and not a “narrative review” or “commentary”.
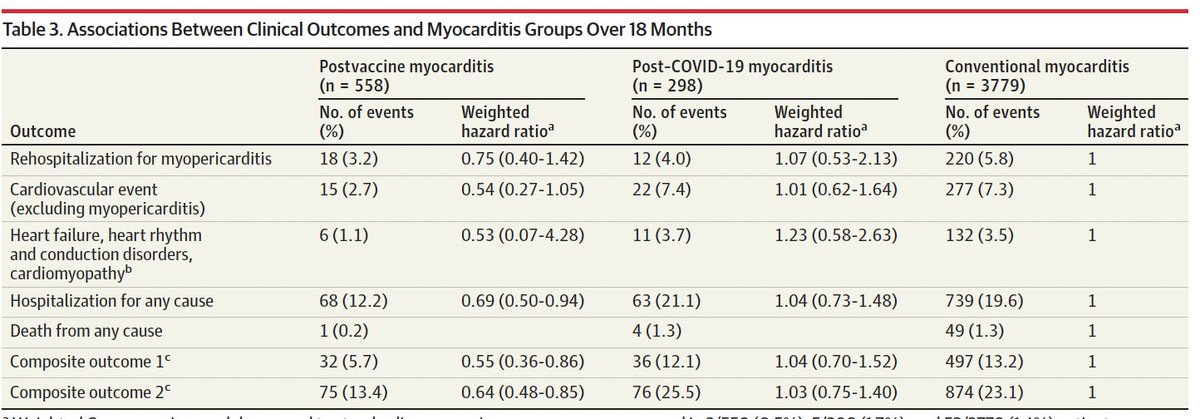
 I should have clarified these cardiovascular events being compared are post SARS-CoV-2 infection


 2/n
2/n
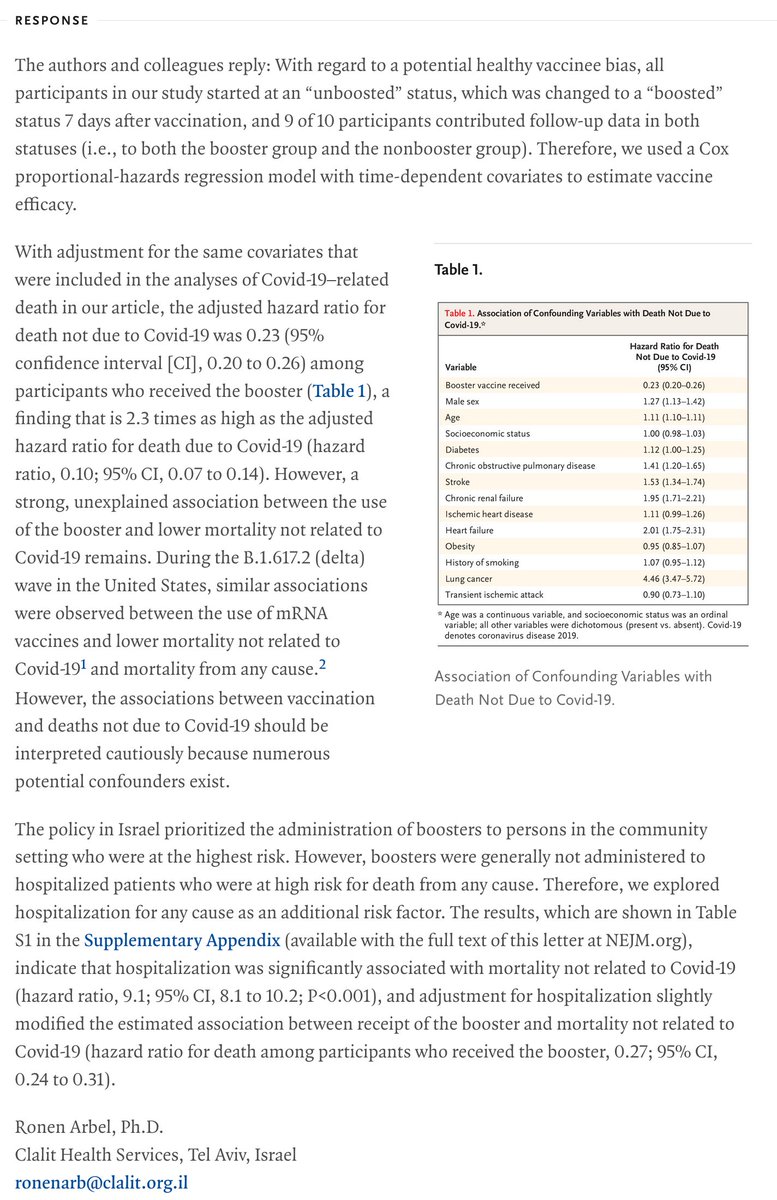
 The healthy vaccinee effect, or healthy user effect, is a well-known phenomenon that people who follow public health recommendations tend to be healthier in general, and this can manifest in vaccine effectiveness studies as unmeasured confounders beyond those included in the… https://t.co/EJ9J23oqRitwitter.com/i/web/status/1…