Most people seem to use matplotlib as a Python plotting library, but is it really the best choice? 🤔
We are going to compare 5 free and popular libraries:
▪️ Matplotlib
▪️ Seaborn
▪️ Plotly
▪️ Bokeh
▪️ Altair
Which one is the best? Find out below 👇
We are going to compare 5 free and popular libraries:
▪️ Matplotlib
▪️ Seaborn
▪️ Plotly
▪️ Bokeh
▪️ Altair
Which one is the best? Find out below 👇

In a survey I did the other day, matplotlib had the most users by a large margin. This was quite surprising to me since I don't really like it...
But let's first look at each library 👇
https://twitter.com/haltakov/status/1436780582361513987
But let's first look at each library 👇
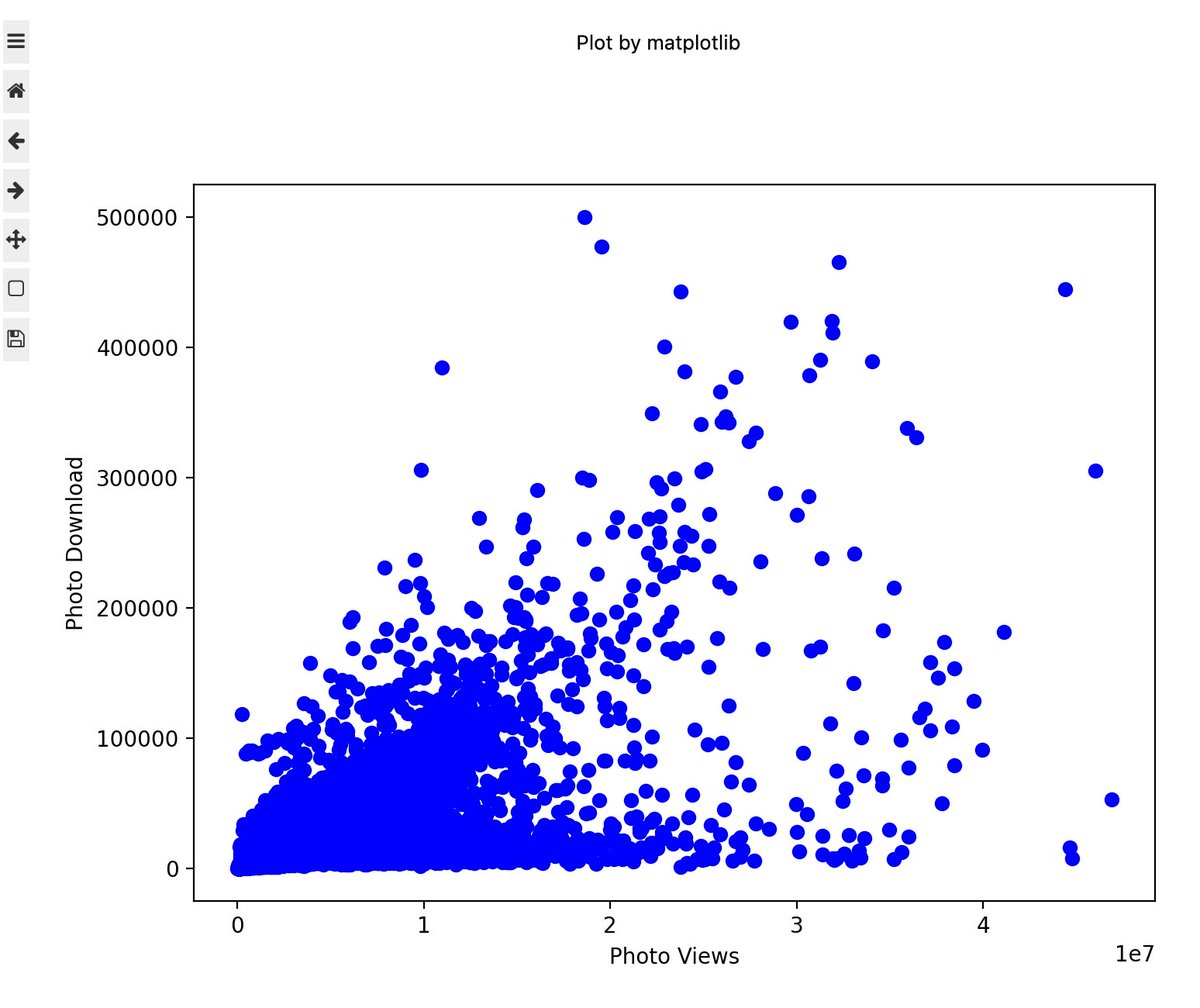
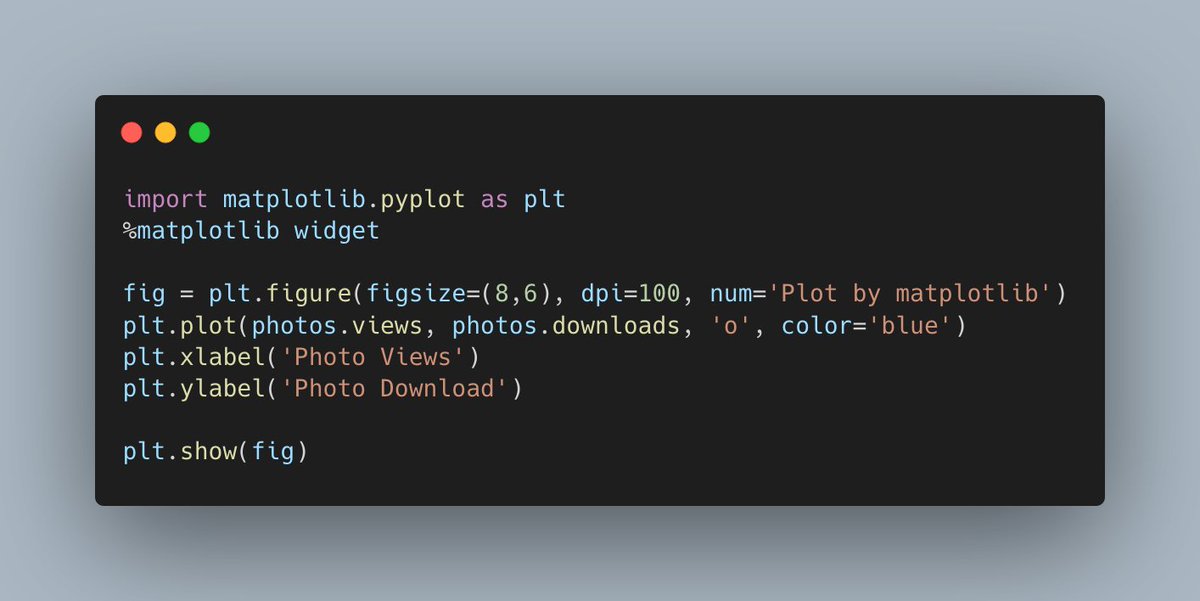
Matplotlib 📈
Matplotlib is one of the most popular libraries out there.
✅ Supports many types of plots
✅ Lots of customization options
❌ Plots look ugly
❌ Limited interactivity
❌ Not very intuitive to use
Matplotlib is one of the most popular libraries out there.
✅ Supports many types of plots
✅ Lots of customization options
❌ Plots look ugly
❌ Limited interactivity
❌ Not very intuitive to use
Seaborn 📈
Seaborn is built on top of Matplotlib, so it inherits many of its features.
✅ Supports many types of plots
✅ Plots look very nice
❌ Limited interactivity
❌ Not very intuitive to use
❌ You need to use maplotlib for many configurations
Seaborn is built on top of Matplotlib, so it inherits many of its features.
✅ Supports many types of plots
✅ Plots look very nice
❌ Limited interactivity
❌ Not very intuitive to use
❌ You need to use maplotlib for many configurations


Plotly 📈
Plotly is a popular library for interactive visualizations.
✅ Plots look nice
✅ Lots of customization options
✅ Easy to use (especially plotly express)
✅ Great interactivity (even by default)
❌ Could be slow for big amounts of data
Plotly is a popular library for interactive visualizations.
✅ Plots look nice
✅ Lots of customization options
✅ Easy to use (especially plotly express)
✅ Great interactivity (even by default)
❌ Could be slow for big amounts of data


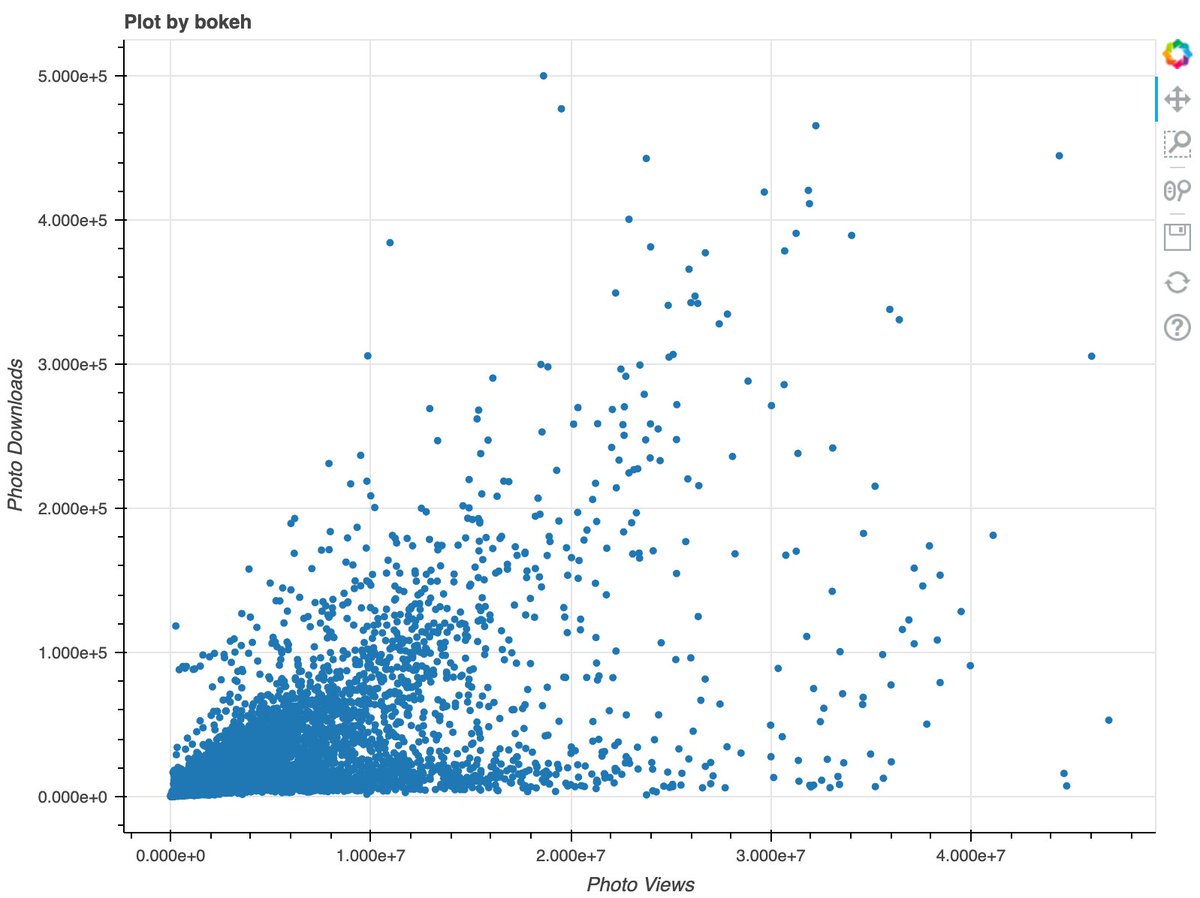
Bokeh 📈
Another cool interactive plotting library.
✅ Plots look nice
✅ Lots of customization options
✅ Good interactivity (but not as good as plotly)
❌ Missing plot types (especially 3D)
Another cool interactive plotting library.
✅ Plots look nice
✅ Lots of customization options
✅ Good interactivity (but not as good as plotly)
❌ Missing plot types (especially 3D)

Altair 📈
A less popular, but very interesting library based on the Vega project.
✅ Plots look nice
✅ Lots of customization options
✅ Good interactivity (but not as good as plotly)
❌ Slow
❌ Cumbersome to use
❌ Embeds all data in the visualization leading to huge files
A less popular, but very interesting library based on the Vega project.
✅ Plots look nice
✅ Lots of customization options
✅ Good interactivity (but not as good as plotly)
❌ Slow
❌ Cumbersome to use
❌ Embeds all data in the visualization leading to huge files


The Winner 🥇
My personal favorite is plotly. I like it because it is very easy to use, offers great interactivity by default and the plots look nice.
Furthermore, plotly also offers a JavaScript version, so it can be practical if you need to show some data on the web.
My personal favorite is plotly. I like it because it is very easy to use, offers great interactivity by default and the plots look nice.
Furthermore, plotly also offers a JavaScript version, so it can be practical if you need to show some data on the web.

Now it's your turn...
Which Python plotting library do you prefer? Why? Have you tried plotly? Feel free to try to convince me that there is a better library! 😄
Which Python plotting library do you prefer? Why? Have you tried plotly? Feel free to try to convince me that there is a better library! 😄
If you want to learn plotly I find the official documentation quite good. They also have lots of examples you can build on.
Start here: plotly.com/python/creatin…
Start here: plotly.com/python/creatin…
https://twitter.com/ammaryh92/status/1437837123839746048?s=20
This is a valid strategy, however, sometimes you just want to do a quick plot to visualize your data.
I think it is very important to keep the friction of displaying data to a minimum. Otherwise you just won't do it sometimes - a missed opportunity.
I think it is very important to keep the friction of displaying data to a minimum. Otherwise you just won't do it sometimes - a missed opportunity.
https://twitter.com/AndrewJacksonZA/status/1437873706697646089
• • •
Missing some Tweet in this thread? You can try to
force a refresh