Data presented below show nearly 33% of unvaccinated adult Israeli residents were previously infected.
Why is this important & has this contributed to misinterpretation of Israeli data?
This thread wll explore these questions.
1/n
Israeli MoH releases periodic vaccination reports on its Telegram site. This table breaks down vaccination status by age groups as of September 14, 2021 listing total population and number given 1/2/3 doses plus those unvaccinated but recovered from previous infection 2/n
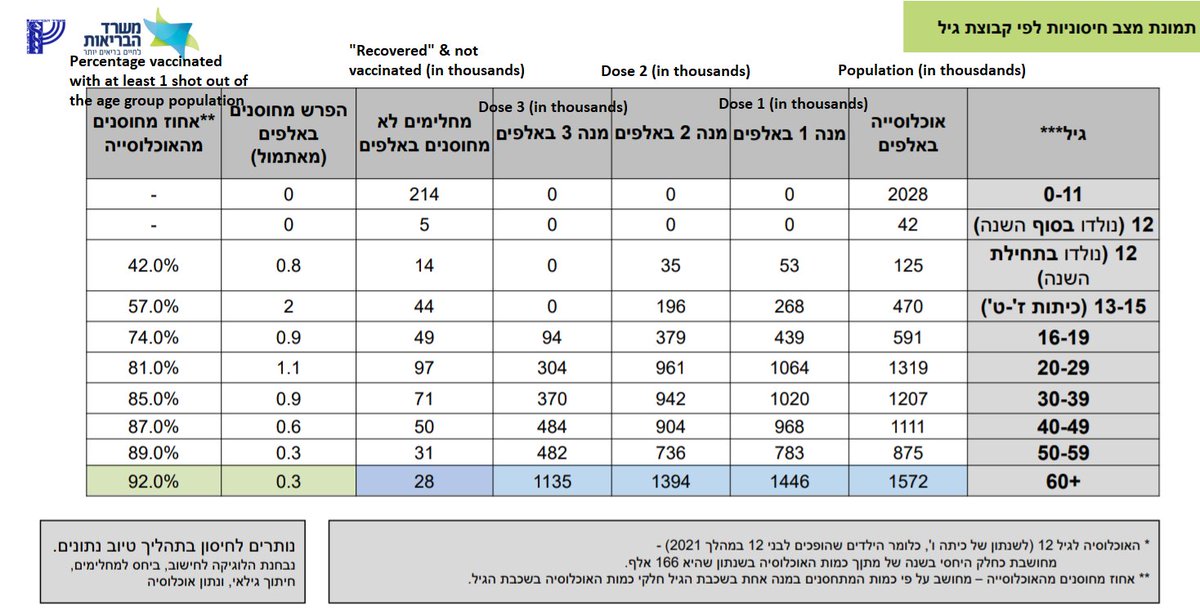
From these data, I constructed this table with % of population unvaccinated, given 1 dose, 2 doses, & 3 doses, & proportion of unvaccinated are previously infected.
Note that >30% of total unvaccinated Israelis were previously infected, & >1/3 for all age groups in 20-59yr 3/n
Why does this matter? Because literature is clear they have strong immune protection even if not vaccinated (see post link below).
As a result, VE estimates will be strongly attenuated if previously infected are not removed from the unvaccinated. 4/n
To illustrate this effect, consider a populaton of 1m, 75% vaccinated, 1/3 unvaccinated previously infected, infection rate of 0.01 for unvaccinated no previous infection, VE=65%, and previous infections reduce risk of reinfection by 90%. Here is the effect: 5/n
We see failure to remove previously infected attenuates VE from 65% to 50%. Here is the same scenario assuming VE=50%, that is attenuated to 28.6% if previously infected are not removed from unvaccinated. 6/n
This is relevant since MoH reported in late July VE reduced to 44% for vax in Feb & 16% for vax in Jan, creating impression that vaccine effectiveness was going to 0% quickly after 6m.
Their report didn’t mention if they removed previously infected. 7/n gov.il/BlobFolder/rep…
Three rigorous studies were done (Mizrahi et al,Israel et al,Goldberg et al) on waning immunity – all removed previously infected & adjusted for confounders as much as possible. Here is the Goldberg paper that also compared with unvaccinated controls. 8/n medrxiv.org/content/10.110…
These all found 1.6-2.2x reduction in VE from those vaccinated in Jan-Feb vs. Apr-May, but relative to unvaccinated, VE reduced from 75-80% to 50-65%., much higher than the 44%/16% MoH reported
Is it possible MoH report mistakenly left previously infected in unvaccinated?
9/n
Since Israel made vax optional for previously infected and then only gave 1 dose, this especially affects the unvaccinated group. Other places, there could be some subset of “fully vaccinated” who were also previously infected and have extra protection.
10/n
For this reason, all locales should, whereever possible, split out data not just by vaccination status but also previous infection status.
And we should all be mindful of this potential effect when evaluating simple analyses to estimate VE.
11/n
BTW thanks to Nurit Baytch who sent me link to MOH methodology document showing in their analyses they DO remove unvaccinated from the strata before estimating VE: t.me/MOHreport/8321
Cleveland Clinic researchers have posted a preprint on medRxiv assessing the flu infection rate among employees who received the flu vaccine relative to those who did not receive the flu vaccine.
Using a Cox regression model while adjusting for age, sex, clinical nursing job, and location (but not propensity to test for flu), they found the vaccinated had a hazard ratio of 1.27, concluding the vaccinated had a 27% higher risk of infection and thus concluding -27% negative vaccine effectiveness.
As in their previous studies on COVID-19 vaccines (cited by many as evidence of negative vaccine effectiveness), this study suffers the same fatal flaw of testing bias, with vaccinated significantly more likely to test for flu than unvaccinated, 27% more likely in fact.
They try to dismiss this concern by claiming the test positivity is equivalent between vaccinated and unvaccinated based on a strange and poorly justified linear regression analysis.
But when looking at the data in their figures 1-2 and summarizing on an appropriate scale, it is clear that the test positivity is substantially lower in vaccinated than unvaccinated (20% lower), so the testing bias cannot be dismissed, and suggesting the increased testing in vaccination is a bias that can explain their HR=1.27 effect, and not indication of higher infection rates.
Thus, their conclusion of -27% negative vaccine effectiveness is not supported by their data.
They compute the daily testing rate in vaccinated and unvaccinated and plotted the ratio of vaccinated/unvaccinated in Table 1a, from which they acknowledge the vaccinated test at a significantly higher rate than unvaccinated.
It is to their credit they acknowledge this.
The increased testing could represent a bias that compromises their conclusion of vaccine effectiveness, or it could be an indication of higher infections, since a 27% higher testing rate could simply be an indicator of 27% higher infection rates.
The test positivity (% of flu tests positive) can be used to assess this possibility.
If the higher confirmed infection rate were simply a function of testing bias, then the testing positivity would be lower in vaccinated than unvaccinated, indicating overtesting, and thus a ratio of testing positivity in vaccinated/unvaccinated would be less than 1.
If the higher testing rate were simply from higher infection rates and not testing bias, we'd expect the testing positivity to be equivalent between vaccinated and unvaccianted, with a ratio near 1.
David Geier has apparently been commissioned by HHS secretary RFK, Jr. to study potential links between vaccination and autism.
He has papers in the past using vaccine safety datalink (VSD) data to perform case-control studies assessing potential links between exposure to Thimerisol-containing hepatitis B vaccines as infants and later diagnosis of atypical autism, or of obesity.
He found highly significant associations in both studies -- linked below -- and conclude this proves that Thimerisol in Hepatitis-B vaccines significantly increases risk of atypical autism, and of obesity.
However, MAJOR PROBLEM:
In both studies his cases and controls were during different time periods,
In the autism study, the dates were:
Autism Cases: 1991-1998
Controls: 1991-1992.
In the obesity study, the dates were:
Obesity Cases 1991-2000
Controls: 1991-1994.
Besides the arbitrary nature of these choices of dates raising suspicion, the use of different dates for cases and controls raises major concerns of time-confounding, especially if Hepatitis-B vaccination rates differed sustantially over the 1991-2000 time period.
See link below to the Hepatitis-B vaccination rates over time -- indeed the vaccination rate increased from <10% in 1991 to ~30% in 1994 to 85-90% in 1998-2000.
Thus, the case-control status is almost COMPLETELY CONFOUNDED with vaccination status, since very few would be vaccinated in 1991-1994 and vast majority vaccinated by 1996-2000.
Thus, the vaccinated would be SEVERELY OVERREPRESENTED in the cases and SEVERELY UNDERREPRESENTED in the controls, producing a spurious association between the exposure and case/control status no matter what outcome is being studied.
In other words, the methodology used in the studies was completely invalid, and the studies fatally flawed.
I hope they do better in the upcoming studies -- ideally they should include experienced biostatisticians and epidemiologists to help use a valid study design and analysis, and ensure that their interpretation of the study is supported by the empirical evidence in the data.
Let's do an exercise to show how their study flaw can generate false associations and invalid conclusions.
Here is a plot of live births and cell phone usage in Sri Lanka from 2001-2009.
Note that cell phone usage increased from <10% in 2001 to 80% by 2009.
We will ask, "Is a woman's cell phone use associated with their likelihood of having a live birth in Sri Lanka?"
We will make the same case/control design mistake made by Geier to introduce the exact same type of time bias and show how it leads to completely spurious results and invalid conclusions.
Consider the following case/control study, defining:
case = woman had a live birth that year
control = woman did not have a live birth that year
As with Meier's study, let's consider cases and controls from different time frames,
cases from 2001-2009 and
controls from 2001-2004
In this illustration, the exposure is "cell phone usage" and we we want to assess if cell phone usage appears related to likelihood of a women having a live birth in a given year.
There is talk from HHS that fluoride in water mau lead to reduced cognitive levels in children.
There is a new published paper on a Bangladeshi study assessing links between urinary fluoride levels and cognitive performance of children at 5yrs and 10yrs that is being touted as evidence of this link.
The authors conclude links between prenatal maternal urinary fluoride levels and children's cognitive levels at 5yrs and 10yrs, between children's urinary fluoride levels at 10yrs and cognitive levels at 10yrs, and also say there is a negative association between urinary fluoride levels at 5 years and cognitive levels at 5yrs and 10yrs that is not statistically significant.
However, when looking at the data and analyses in the paper in detail, the evidence for these links are at best very weak, and the paper really shows very little evidence.
In this thread, I will explain some of the data and statistical details that lead me to that conclusion.
The primary question of this study is whether fluoride exposure from water is linked with lower cognition, which in this study involves analyzing potential associations between urinary fluoride levels at 5yrs and and cognitive scores at 5yrs and 10yrs, urinary fluoride levels at 10yrs with cognitive scores at 10yrs, and prenatal urinary fluoride levels at 8wks gestation with cognitive scores at 5yrs and 10yrs.
They propose that given fluoride's low half-life, the urinary fluoride levels should be a reasonable surrogate for fluoride levels in the water, and they measure water fluoride levels at the 10yr time point to show evidence of some correlation with the urinary levels.
While the authors confidently conclude evidence for a link, when one looks at the actual data there is little to no evidence of any link, and they have to take a series of unusual and potentially questionable statistical steps to arrive at these conclusions.
I will describe what I mean.
Given that the primary hypothesis is whether fluoride in the water leads to decreased cognitive abilities in children, I will start with the analysis of children's urinary fluoride levels and their cognitive test results at 5yrs and 10yrs.
Many people misunderstand "indirect costs" (i.e. F&A) from NIH grants, thinking these are superfluous or unnecessary costs or a "gift" to universities.
Indirect costs are actually "Facility and Administrative" (F&A) expenses that are not allowed to be included in the direct cost budget of an NIH grant, but are essential for research.
Below is a video that explains how the system works, what F&A expenses cover, how they are determined, and why they are essential, and how the proposed severe reduction of 65-80% of these expenses endangers the entire USA research enterprise that leads the world and provides great societal benefit, technologically, medically, and economically.
The indirect costs, or Facilities and Administrative (F&A) expenses, are not a "tip" or "fluff" for the universities, but cover essential research costs that are not allowed to be included in the direct cost budget for an NIH grant, including:
* Laboratory and other research-specific facilities
* Utilities including electricity, gas, water, HVAC
* Shared research instruments
* Maintenance and security for research facilities
* IT and cybersecurity infrastructure
* Administrative staff needed to meet federal requirements including safety, compliance, and research operations.
Research could not be done without these expenses, and without F&A it is not clear how they can be covered.
Typically, the indirect costs from grants only partially cover these expenses, with universities and research centers having to cover 30-50% of these required expenses through other means.
As a result, universities subsidize federal research, and typically lose a substantial amount of $$ for their research enterprise.
Journal of Infection and Public Health just published a paper summarizing case fatality rate (CFR) and infection mortality rate (IFR) for all of Austria from February 2020 through May 2023.
Critically, they also split out results over time, by variant, age group, vaccination and previous infection status, sex, and nursing home residency status.
Key results were: 1. CFR was much higher in older age groups and nursing home residents 2. CFR decreased greatly with later variants, coincident with increases in population immunity levels from vaccination and previous infection. 3. Vaccinated individuals had substantially lower CFR for each variant/age group 4. Those surviving previous infection had substantially lower CFR for each variant/age group. 5. The immune protection evident in reduced CFR was similar in vaccinated and those surviving previous infection for each variant/age group.
In this thread, I will summarize and try to make sense of its key results.
There are other papers looking at CFR/IFR, but none as expansive or rigorous as this one.
Austria had very restrictive early mitigation measures and mass vaccination like most higher income countries, which makes its results relevant to many richer Western countries.
Also, Austria had the highest SARS-CoV-2 testing rate among non-island nations in the world, making it ideal for this study since they had fewer undocumented infections than other countries.
Most results presented in the paper are of case fatality rate (CFR), computed as:
This study also estimated infection fatality rate (IFR), imputing the estimated number of undocumented infections using a model based on testing positivity rate (TPR=% of positive tests), with the reasoning that time periods with high TPR should have higher numbers of undocumented infections.
CFR was significantly higher than IFR during 2020 when testing was more sparse, but starting 2021 less so given Austria’s extraordinarily high testing rate.
My colleagues and I just published a paper in eClinicalMedicine evaluating effects of vaccination on long COVID risks in children and adolescents during the Delta and early Omicron periods.
These data were from the RECOVER network including 21 pediatric hospital networks from all over the USA, including 112,590 adolescents during the Delta period, and 84,735 adolescents and 188,894 children during the early Omicron period.
Long COVID-19 (post-acute sequelae of SARS-CoV-2, PASC, or multi-system inflammatory syndrom, MIS) was defined using a symptom-based computable phenotype definition based on five body systems.
Our analyses utilized propensity score weighting to adjust for confounding from age, demographics, medical co-morbidities as well as healthcare utilization including past COVID-19 testing practices, and we used proximal analyses with negative control exposures and outcomes to investigate and adjust for potential residual bias from unmeasured confounders.
In adolescents 12-20yrs, we found vaccination resulted in 95.4% reduced risk of long COVID-19 during the Delta period, and 75.1% during the Omicron period.
In children 5-11yrs, we found vaccination resulted in 60.2% reduced risk of long COVID-19 during he Omicron period.
To evaluate how much of this vaccine protection was from reduced risk of infection and how much was reduced risk of long COVID-19 independent of any effect in reducing infection, we performed a causal mediation analysis to split the total vaccine effect into indirect effects, mediated through reducing risk of infection, and direct effects, independent of any reduced risk of infection.
Again, propensity score weighting was used to carefully adjust for potential confounders.
We found that the protective effect of vaccines on long COVID-19 was almost wholly mediated through its reduced risk of infection.
Various sensitivity analyses were done and included in the online supplement along with a detailed description and explanation of all methods and modeling decisions.
These data were from the RECOVER network including 21 pediatric hospital networks from all over the USA, including 112,590 adolescents during the Delta period, and 84,735 adolescents and 188,894 children during the early Omicron period
Our analyses utilized propensity score weighting to adjust for confounding from age, demographics, medical co-morbidities as well as healthcare utilization including past COVID-19 testing practices, and we used proximal analyses with negative control exposures and outcomes to investigate and adjust for potential unmeasured confounders.