Estimating CO₂ emissions from forests is difficult, not least because of different definitions.
CO₂ emissions come from conversion (cutting down or growing a tree).
There is also a 'sink', soaking up CO₂ we previously emitted.
What should be reported as CO₂ emissions?
1/
CO₂ emissions come from conversion (cutting down or growing a tree).
There is also a 'sink', soaking up CO₂ we previously emitted.
What should be reported as CO₂ emissions?
1/

It is really rather complex. The reason the 'sink' is included in emission accounting, is that it is difficult to determine what is 'anthropogenic'.
It was decided to use self-defined 'managed land' & include 'indirect' (climate) effects.
carbonbrief.org/guest-post-cre…
2/
It was decided to use self-defined 'managed land' & include 'indirect' (climate) effects.
carbonbrief.org/guest-post-cre…
2/

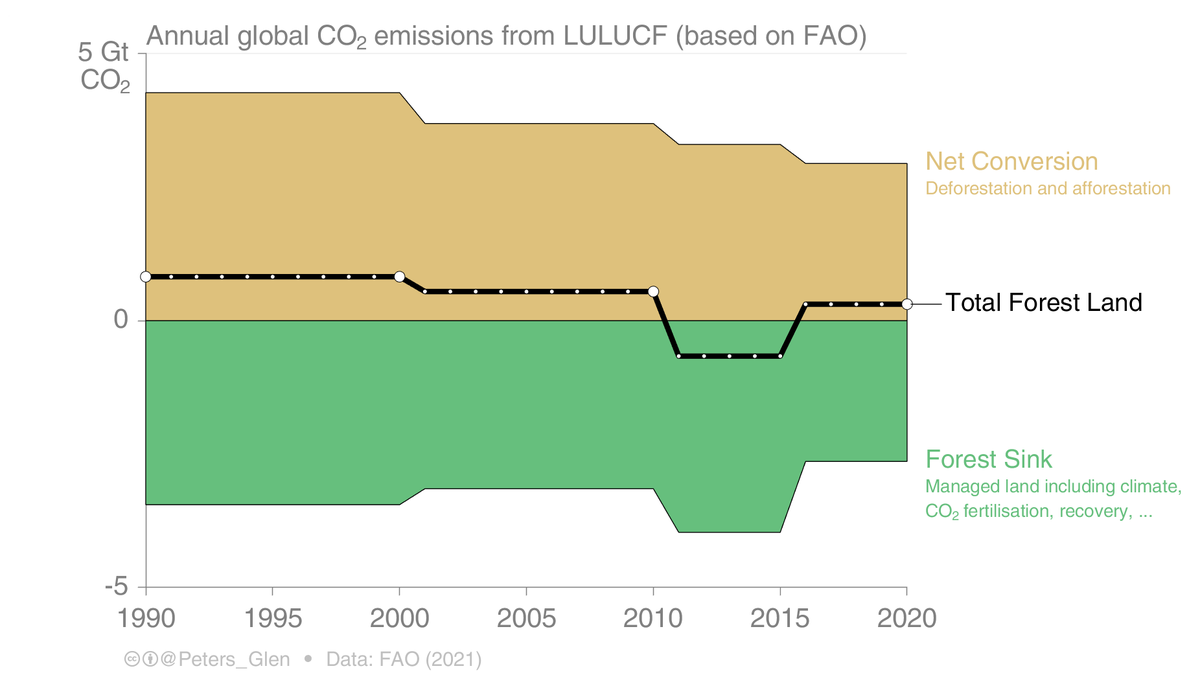
Scientific studies (eg IPCC Assessment Reports) generally consider CO₂ emissions from 'Net Conversions' as the emissions, while government reporting to the UNFCCC combines the conversions & sink (black line).
The 'sink' is not the total sink, only a part of the forest sink.
3/
The 'sink' is not the total sink, only a part of the forest sink.
3/
It is more complex, but @giac_grassi & colleagues are developing methods to 'bridge' between the different estimates. Why?
The rich set of scientific models generally do not report emissions in a way that is comparable to what countries report! Grrr!
carbonbrief.org/guest-post-a-r…
4/
The rich set of scientific models generally do not report emissions in a way that is comparable to what countries report! Grrr!
carbonbrief.org/guest-post-a-r…
4/

Here is a rough comparison of the scientific models (IPCC WG1 Figure 5.5b) & the FAO data consistent with UNFCCC reporting.
The FAO 'conversion' are not as comprehensive, & only agree with one dataset (Houghton).
The 'totals' are completely different (apples vs oranges).
5/
The FAO 'conversion' are not as comprehensive, & only agree with one dataset (Houghton).
The 'totals' are completely different (apples vs oranges).
5/

This is all at the global level. Uncertainties are high. Country-level estimates are more uncertain...
Many ask for country-level LULUCF estimates, but it is incredibly difficult to do this. Just taking any dataset with data available could send a very misleading picture.
6/6
Many ask for country-level LULUCF estimates, but it is incredibly difficult to do this. Just taking any dataset with data available could send a very misleading picture.
6/6
• • •
Missing some Tweet in this thread? You can try to
force a refresh