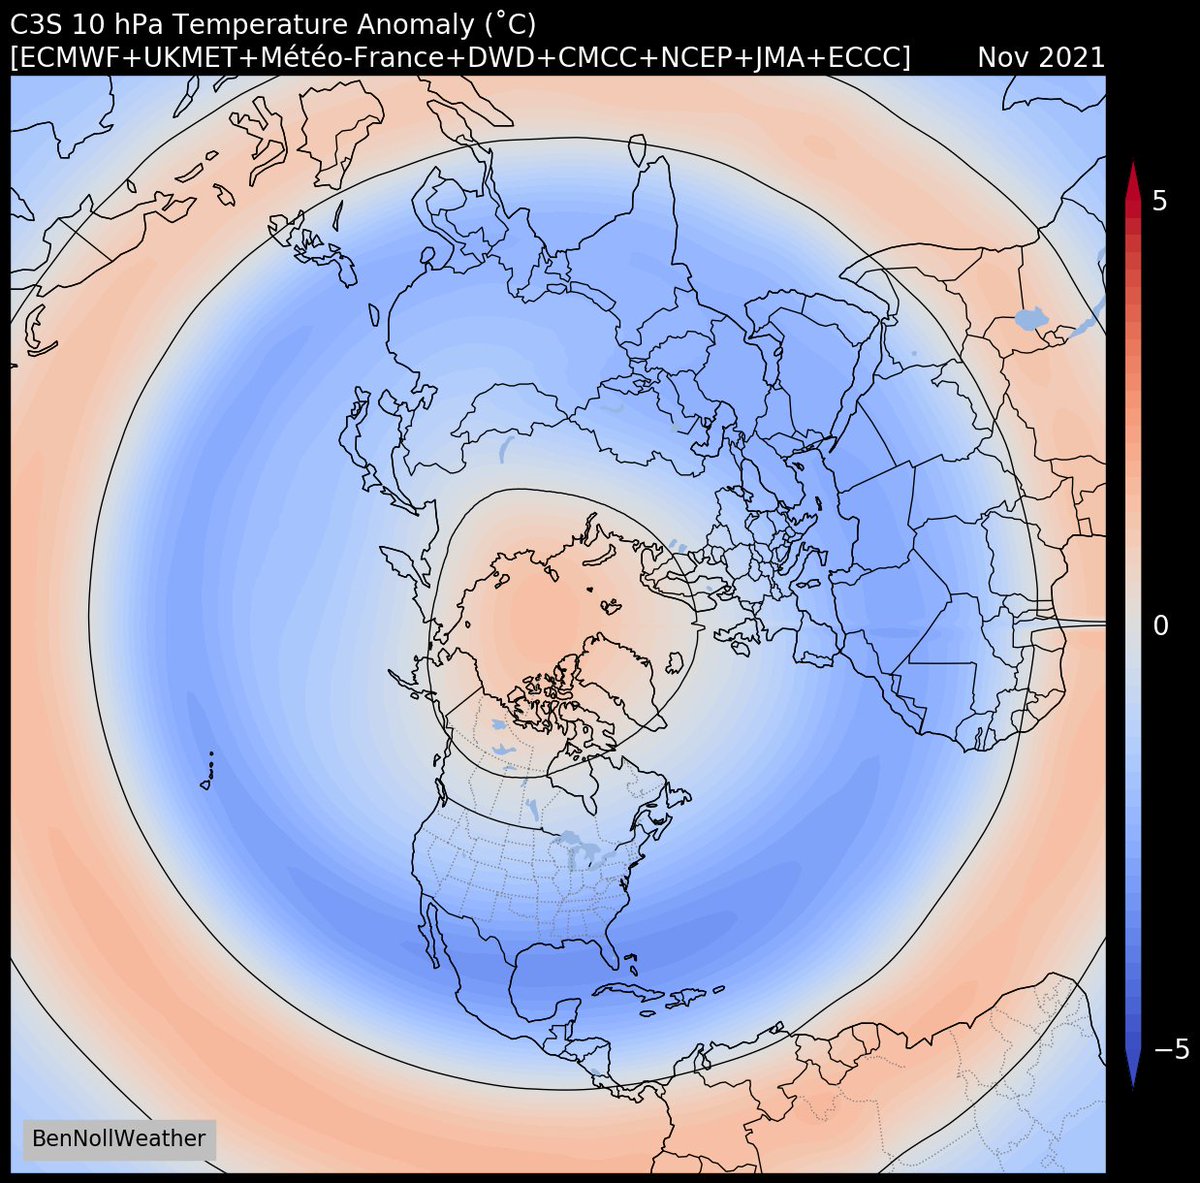
December 2021: this forecast of stratospheric temperature anomalies is pretty unusual 🔴
How unusual? The zonal mean anomaly between 60-90˚N is the *2nd warmest* predicted by @ECMWF (from September) compared to all years from 1993-2020.
🧵 Thread: winter forecast tea leaves 🌿
How unusual? The zonal mean anomaly between 60-90˚N is the *2nd warmest* predicted by @ECMWF (from September) compared to all years from 1993-2020.
🧵 Thread: winter forecast tea leaves 🌿

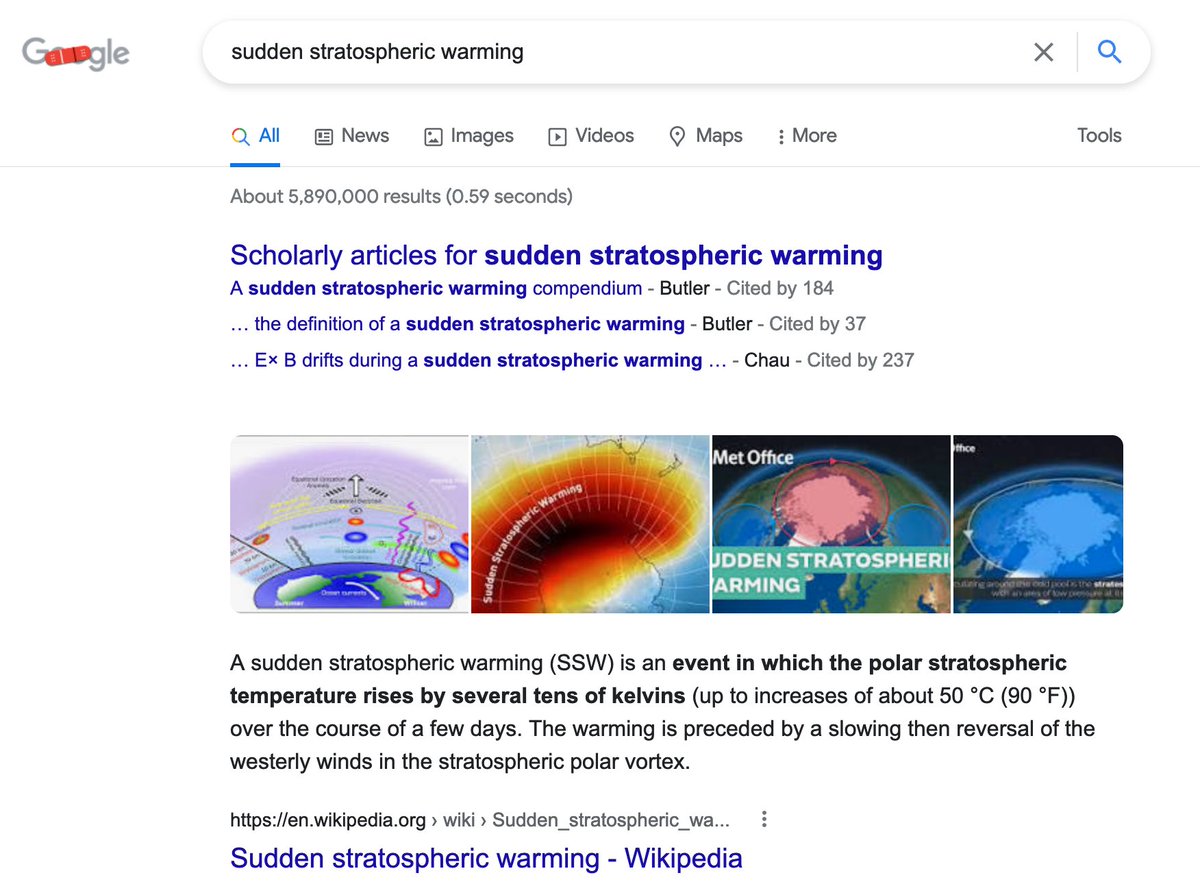
The stratospheric polar vortex, located high up in our atmosphere above the poles during winter, weakens substantially about ~6 times per decade when a sudden warming & west-to-east wind reversal occurs.
This can end up bringing cold weather to the troposphere, where we live 🥶
This can end up bringing cold weather to the troposphere, where we live 🥶
Sudden Stratospheric Warming (SSW) events, as they're called, are predictable weeks to months in advance, but we don't often get a signal seasons out.
Well, in 2021-22, we are getting a signal and it's a pretty strong one! 💪
This is helpful with winter climate predictability.
Well, in 2021-22, we are getting a signal and it's a pretty strong one! 💪
This is helpful with winter climate predictability.
In 28 years of seasonal ECMWF guidance issued in September, there was a signal (≥1σ) for an SSW in 4 Decembers before this year.
An SSW happened in 3 out of 4 of those winters, but there were misses in the early 2000s.
The signal in 2021-22 is the 2nd strongest of all cases 📶
An SSW happened in 3 out of 4 of those winters, but there were misses in the early 2000s.
The signal in 2021-22 is the 2nd strongest of all cases 📶
Let's take a moment to appreciate this.
This may turn out to be one of the earliest possible SSW events identified prior to the winter season in modern times.
We have a lot of time to watch this unfold. That's a luxury when it comes to forecasting!
This may turn out to be one of the earliest possible SSW events identified prior to the winter season in modern times.
We have a lot of time to watch this unfold. That's a luxury when it comes to forecasting!
This shows how the 2021-22 *forecast* SSW may dramatically affect atmospheric height patterns.
👀 Eyes on the upper right corner!
In Dec-Jan, the stratosphere couples with the troposphere above the North Pole.
High heights at high-lats ↔️ cold air can escape to mid-lats 🐻❄️
👀 Eyes on the upper right corner!
In Dec-Jan, the stratosphere couples with the troposphere above the North Pole.
High heights at high-lats ↔️ cold air can escape to mid-lats 🐻❄️
📞 Teleconnections: stratospheric winds high above the equator are linked to winter weather!
The easterly descending phase of the Quasi-Biennial Oscillation brings an increased chance of SSW events.
Watch the upper right: Dec-Jan westerly winds slow (🔵), jet stream weakens.
The easterly descending phase of the Quasi-Biennial Oscillation brings an increased chance of SSW events.
Watch the upper right: Dec-Jan westerly winds slow (🔵), jet stream weakens.
Good news! We have 9 December stratospheric warming events (≥1σ) that we can use as reference points: 2018, 2003, 2001, 2000, 1998, 1997, 1987, 1968, 1960.
What was the weather like during December of those years? The following January...?
🕵️♂️ Forecast clues 👇
What was the weather like during December of those years? The following January...?
🕵️♂️ Forecast clues 👇

In December of the historical SSW events, higher heights occurred at higher latitudes & a Greenland block developed.
This pattern was favorable for coastal storms in the eastern U.S. & European winter storms.
The SSW is 1 of many climate drivers. There are no 1:1 relationships!
This pattern was favorable for coastal storms in the eastern U.S. & European winter storms.
The SSW is 1 of many climate drivers. There are no 1:1 relationships!

In January of the historic SSW events, the high latitude blocking signal (🔴) persisted.
The threat for harsh winter weather pushed southward into Asia & affected western North America 🌨️
A negative North Atlantic Oscillation continued, impacting conditions in Europe.
The threat for harsh winter weather pushed southward into Asia & affected western North America 🌨️
A negative North Atlantic Oscillation continued, impacting conditions in Europe.

What about SSW forecast confidence? Confidence can arise from agreement across different models. An average of multiple models is better than the best individual model!
If we look at an average of 8 different models, the signal is still alive and well, strongest in November.
If we look at an average of 8 different models, the signal is still alive and well, strongest in November.
Is there model skill in predicting an SSW this far in advance? Yes!
Outlooks for November & December look to have the most skill, considering forecasts issued during August.
Maybe @WorldClimateSvc will share the September skill charts 🙂
Outlooks for November & December look to have the most skill, considering forecasts issued during August.
Maybe @WorldClimateSvc will share the September skill charts 🙂
https://twitter.com/WorldClimateSvc/status/1426258448484864001?s=20
This still doesn't guarantee an SSW will occur!
Although the signal has been present for the last several months (see tweet below from June), forecasters will look for it to persist & intensify (or not) over the next few months.
Although the signal has been present for the last several months (see tweet below from June), forecasters will look for it to persist & intensify (or not) over the next few months.
https://twitter.com/BenNollWeather/status/1405155705712037889?s=20
🗣️ Seasonal outlooks are very different from weather forecasts.
A forecaster has different tools in his belt to tackle different time scales.
Short-term weather, sub-seasonal forecasts, seasonal climate outlooks, and climate change projections & their interpretation is unique.
A forecaster has different tools in his belt to tackle different time scales.
Short-term weather, sub-seasonal forecasts, seasonal climate outlooks, and climate change projections & their interpretation is unique.
📃 There are many publications on SSWs, their predictability, causes, and impacts. Want to learn more? Google it.
There are also some fantastic resources to monitor real-time forecasts, like @SimonLeeWx's website: simonleewx.com/gefs-35-day-10… & ECMWF weeklies: apps.ecmwf.int/webapps/opench…
There are also some fantastic resources to monitor real-time forecasts, like @SimonLeeWx's website: simonleewx.com/gefs-35-day-10… & ECMWF weeklies: apps.ecmwf.int/webapps/opench…
If some densely populated areas experience a winter that seems particularly cold, it doesn't detract from the bigger picture: we live in a warming world 📈
Our perceptions of warm vs cold may be subconsciously changing, so even a marginally cold winter could feel really cold.
Our perceptions of warm vs cold may be subconsciously changing, so even a marginally cold winter could feel really cold.
🤷♂️ Big whoop. Winter is cold. What's the big deal here?
This type of information can be useful for those involved with commodities & the primary sector as well as long-term planning for more resilient energy systems when it comes to extreme temperatures & population growth.
This type of information can be useful for those involved with commodities & the primary sector as well as long-term planning for more resilient energy systems when it comes to extreme temperatures & population growth.

💭 In conclusion, you can think of the polar vortex forecast this winter like someone walking home after a fun Friday night out on the town...
🌀 A polar vortex "lacking coordination" has a higher chance of bumping into your part of the Northern Hemisphere 🍻
🌀 A polar vortex "lacking coordination" has a higher chance of bumping into your part of the Northern Hemisphere 🍻
• • •
Missing some Tweet in this thread? You can try to
force a refresh