
Global weather writer and meteorologist for @washingtonpost | Weather and climate analysis and visuals | #HudsonValley snow days
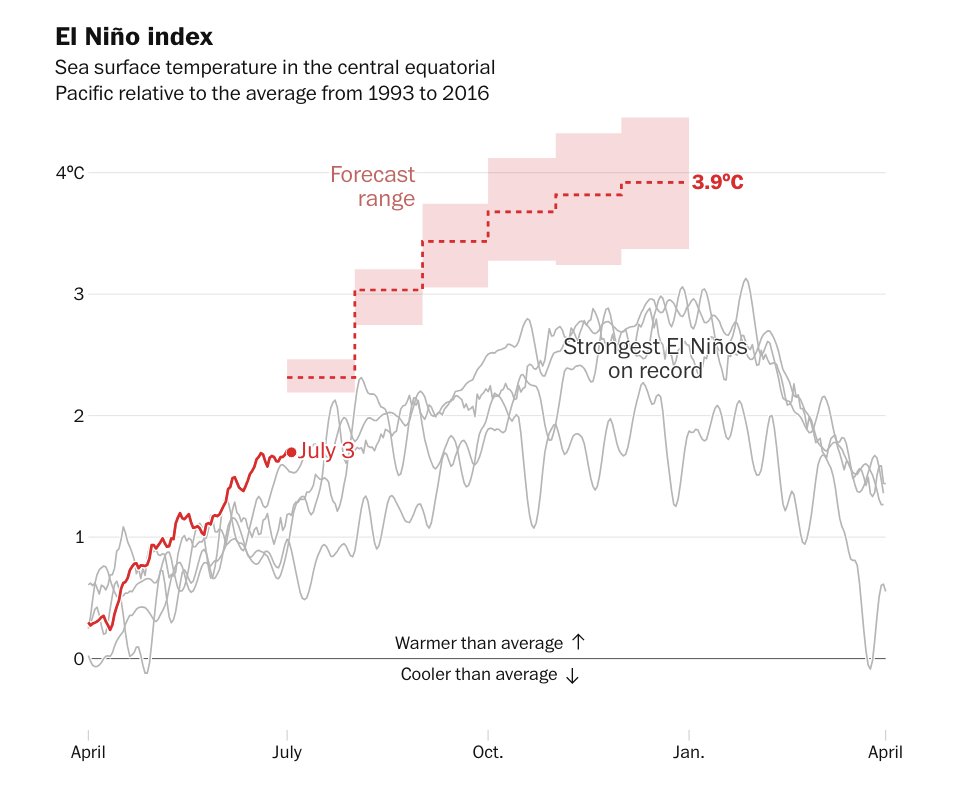 You'll be greeted by a chart with near-current El Niño conditions and a six-month forecast plume.
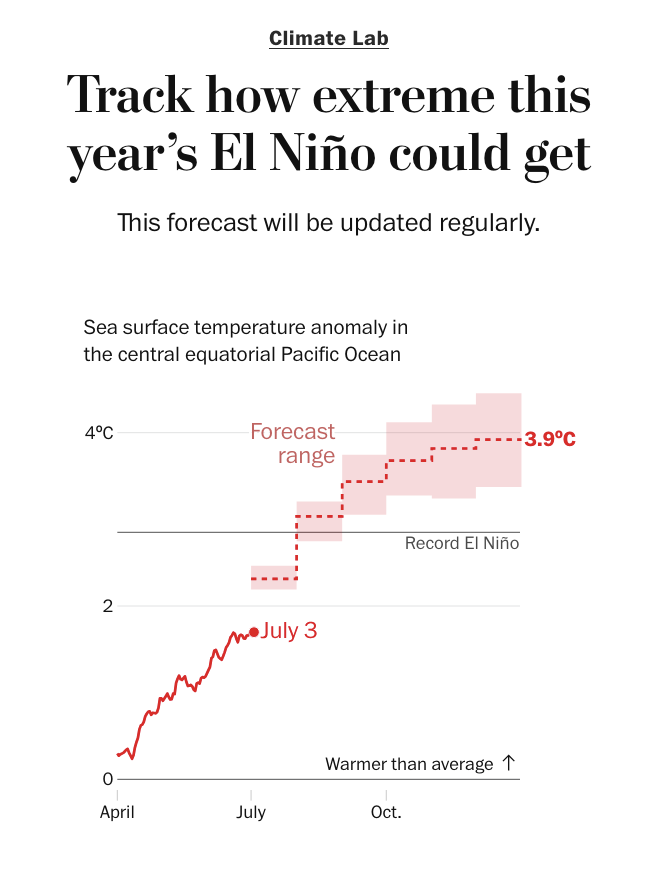
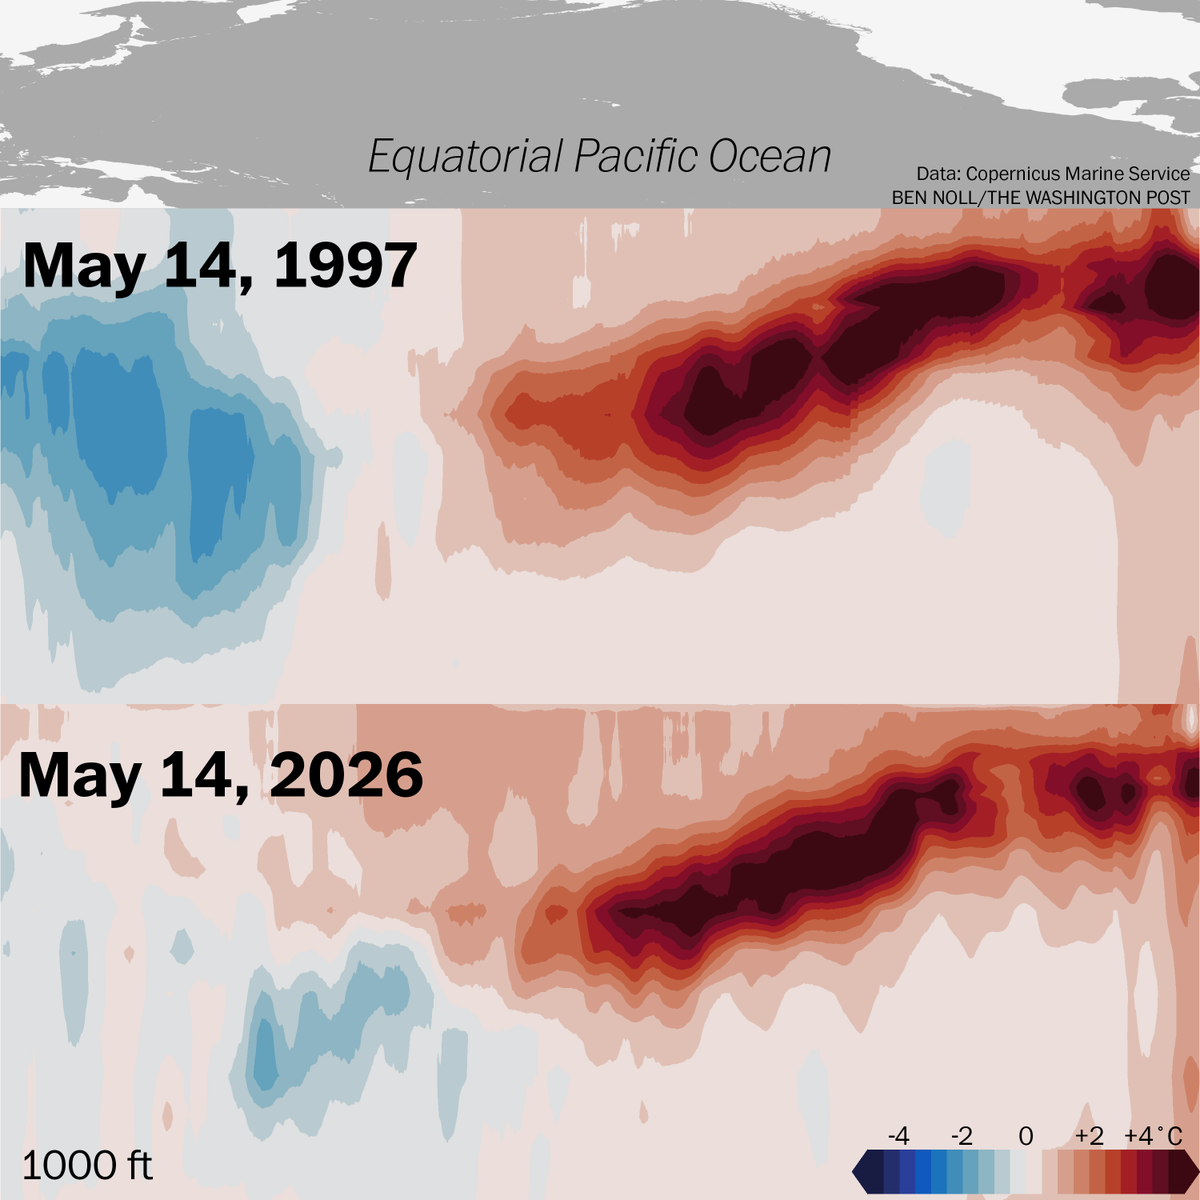
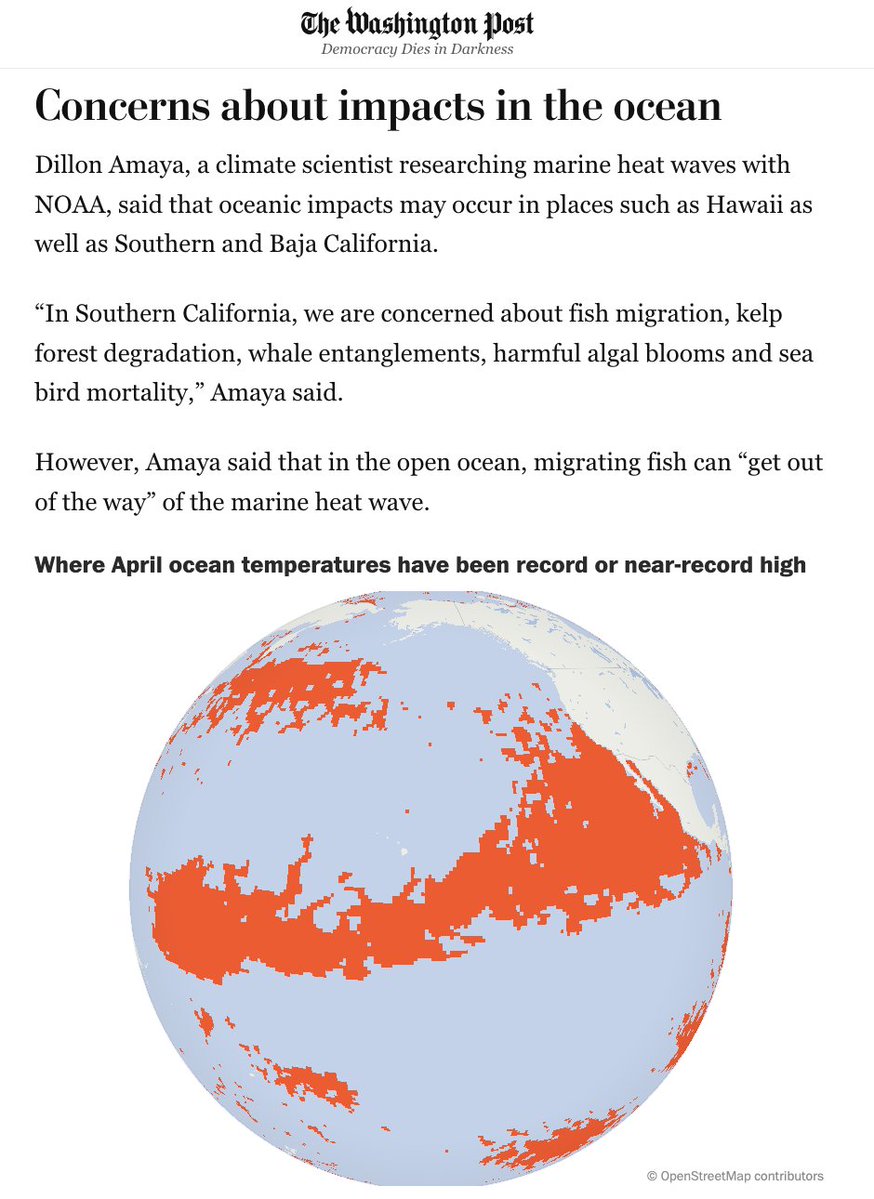
 The enormous Pacific marine heat wave formed as two separate marine heat waves combined: one in the North Pacific and another associated with a developing super El Niño along the equator.
 Strong El Niño periods often appear as an upward stairstep in long-term plots of global temperatures — but this El Niño, because of its expected intensity, could be worth two stairsteps instead of one.
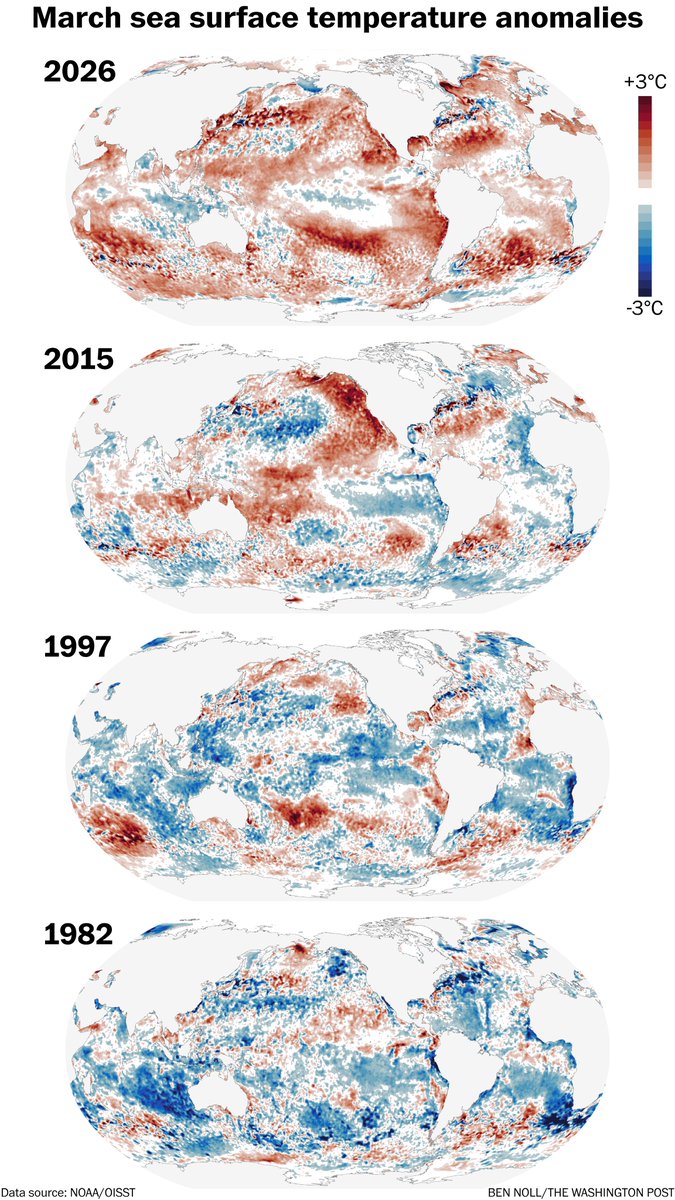

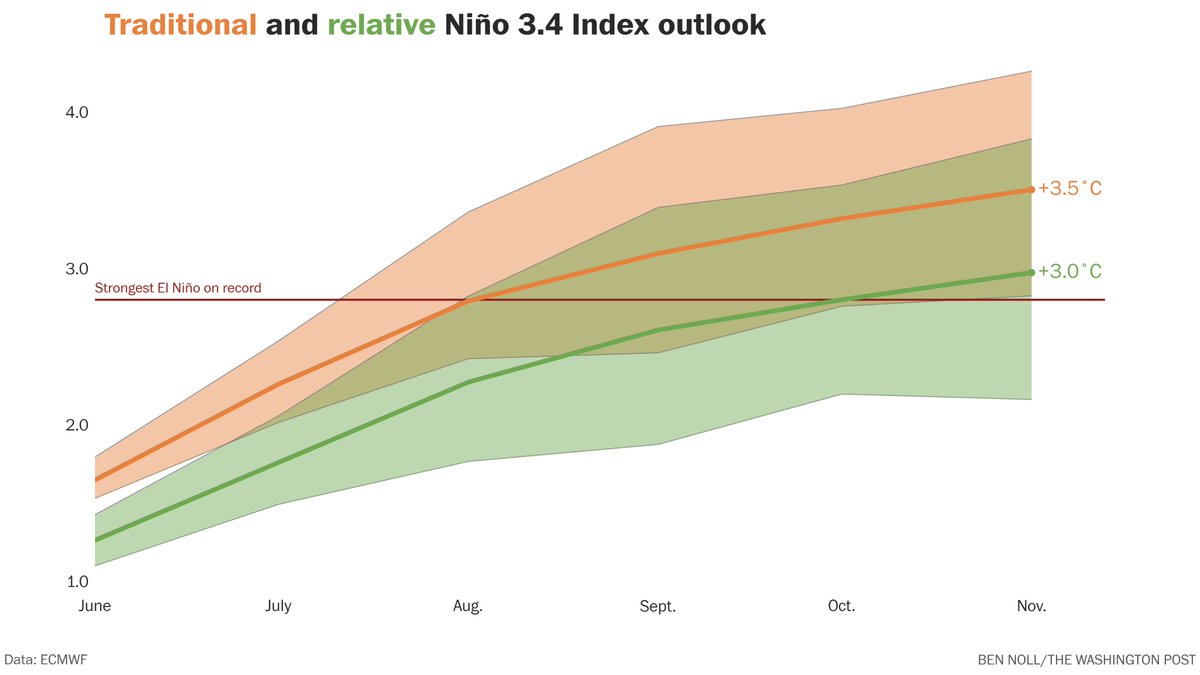
 The El Niño Costero outlook is also extreme, with scenarios generally ranging from +3˚C to +5˚C.
 There was no way to know that such a powerful El Niño was coming in 1877, nor what it meant.


 Harsh winds caused by El Niño probably won't be conducive to lots of Atlantic hurricanes, but it only takes one storm for it to be a memorable season.
 Humid days are rising the most in the Gulf Coast region, Southeast and Florida, where an extra three weeks’ worth of extremely humid days are now packed into the three months of summer in some places.
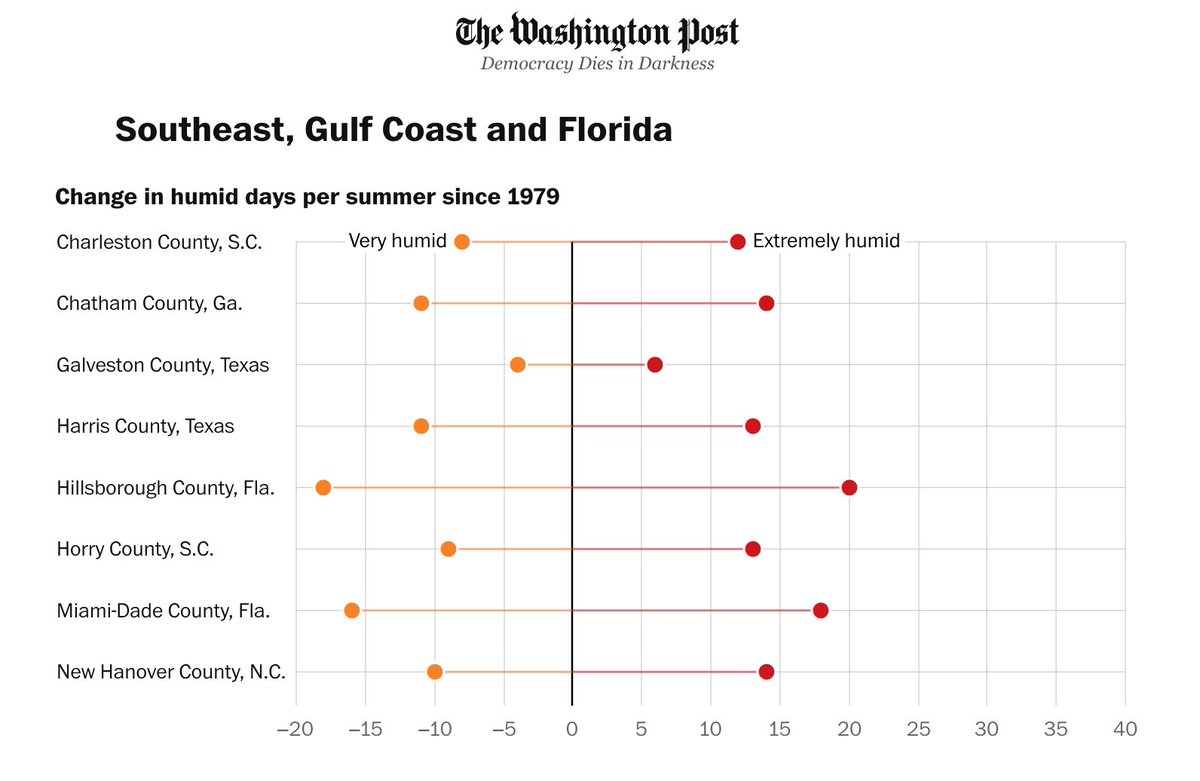
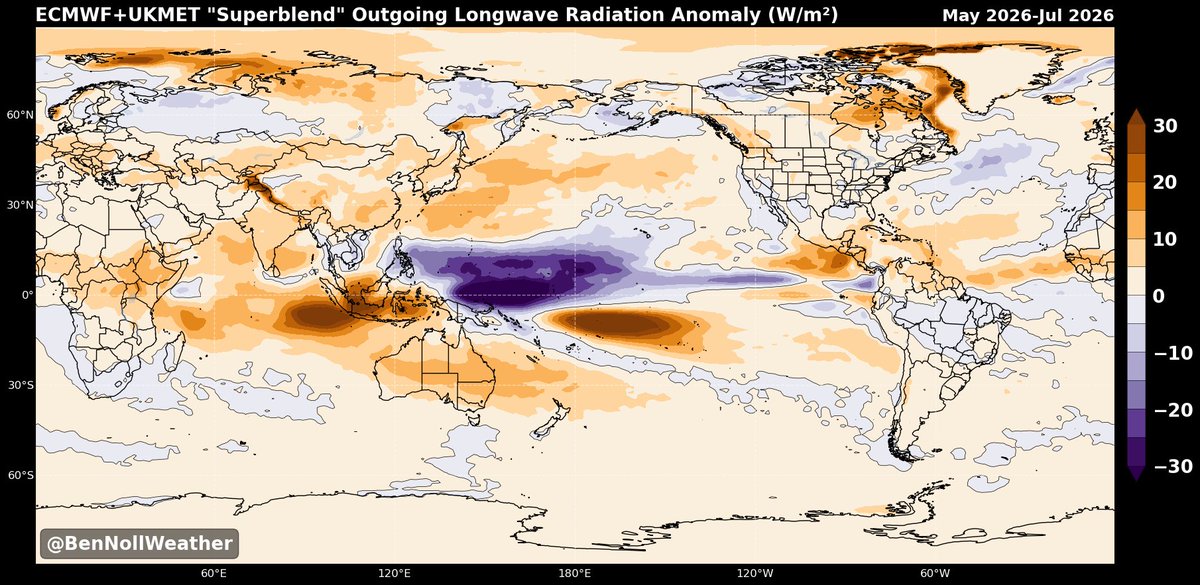
 A La Niña-like pattern will be in place as winter approaches.
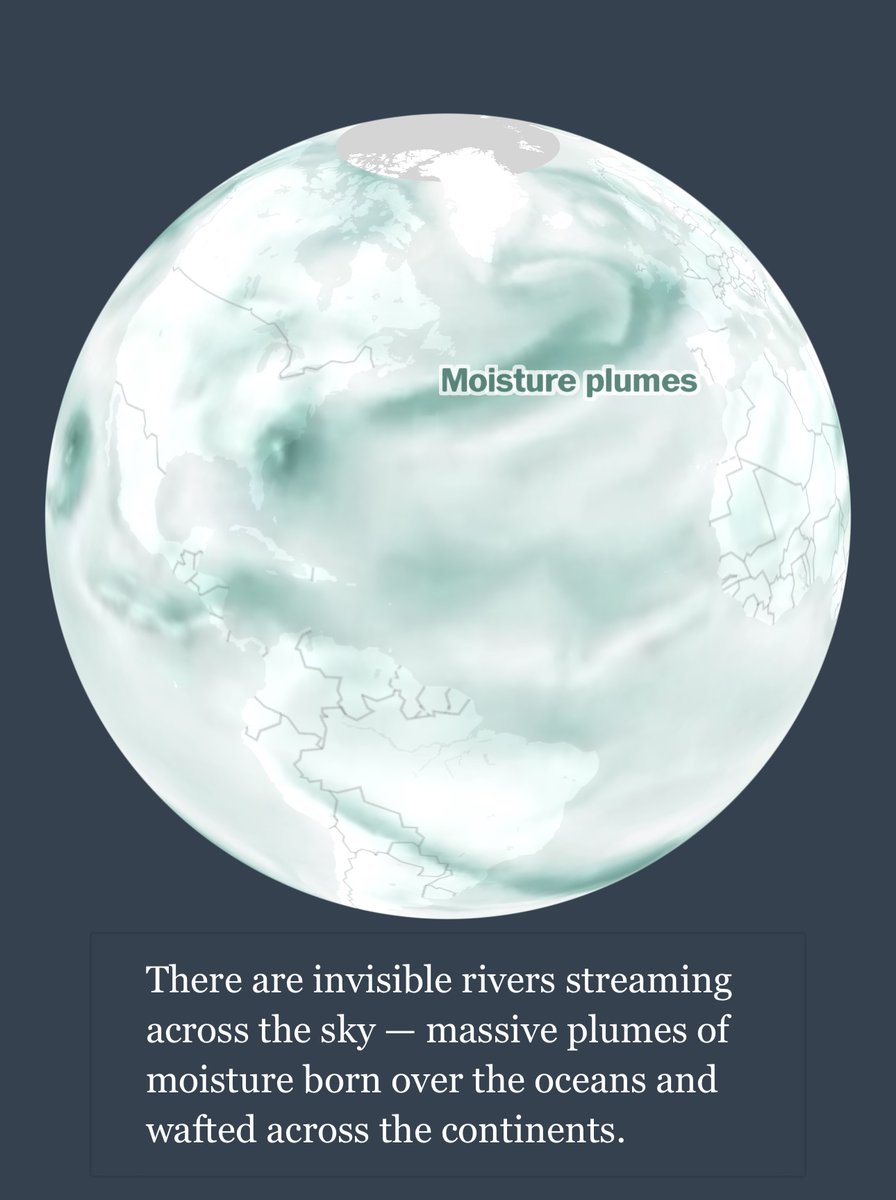
 Corridors of unusually high atmospheric moisture have developed near areas of much warmer than average oceans — which happen to be located near densely populated parts of the Northern Hemisphere.

 A big global story is how warm the oceans are, especially in the Northern Hemisphere.
 Nights during June were very unusually warm.