
🧵 Russia's opposition has claimed this election saw higher levels of fraud than any other in the country's recent history.
How have they calculated that and just how different might the State Duma vote tallies be from reality?
A thread. Long. With graphs. (1)
How have they calculated that and just how different might the State Duma vote tallies be from reality?
A thread. Long. With graphs. (1)

Disclaimer 1: This is not an endorsement, nor my own calculations, just demonstrating the methodology
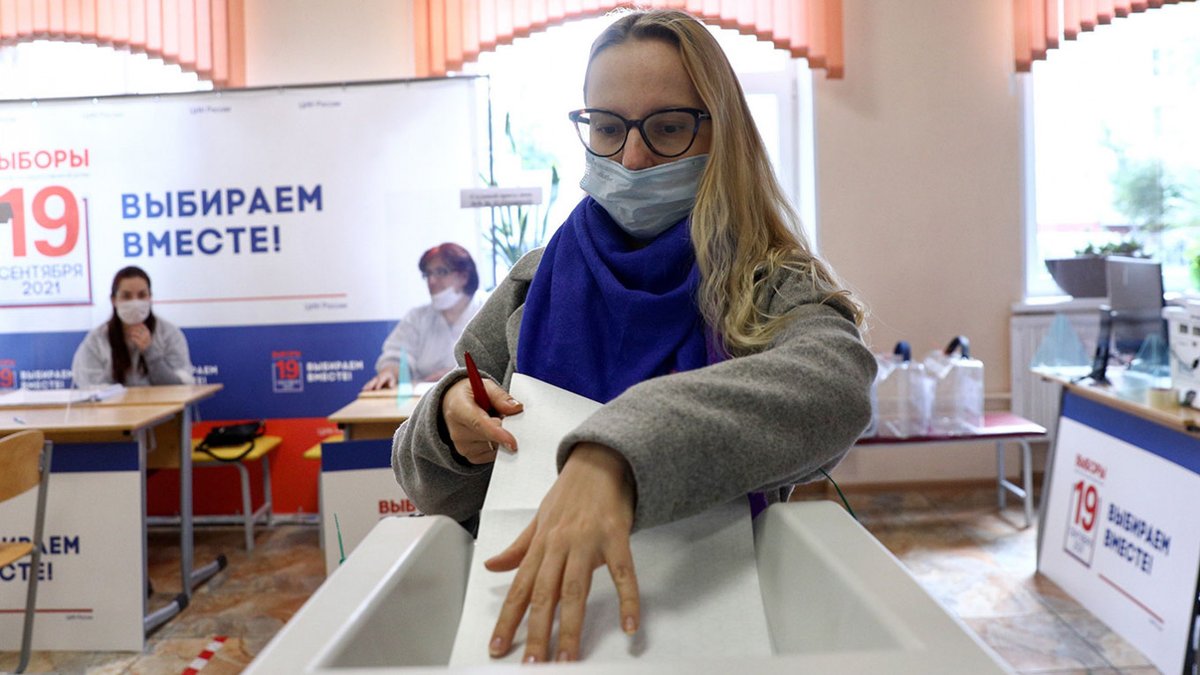
Disclaimer 2: We are talking here about possible on-the-day falsifications, not the wider idea of a “free and fair” election. Just the actual votes cast. How many were real? (2)
Disclaimer 2: We are talking here about possible on-the-day falsifications, not the wider idea of a “free and fair” election. Just the actual votes cast. How many were real? (2)
One method that has proved popular among Russian political scientists is to compare overall turnout with vote share for the ruling United Russia party in each and every individual polling station (almost 100,000 across the country). (3)
The idea is that across such a vast dataset, and on the understanding that potentially false votes do not get added to *every* (or even most) polling stations, you can spot - and add-up - the outliers and potential fakes. (4)
Here come the graphs.
Bottom axis: overall turnout.
Side axis: vote share for United Russia
Each dot represents one polling station. For instance, if a polling station had a turnout of 50%, and 50% of those voted for UR, it gets a dot bang in the middle. (5)
Bottom axis: overall turnout.
Side axis: vote share for United Russia
Each dot represents one polling station. For instance, if a polling station had a turnout of 50%, and 50% of those voted for UR, it gets a dot bang in the middle. (5)
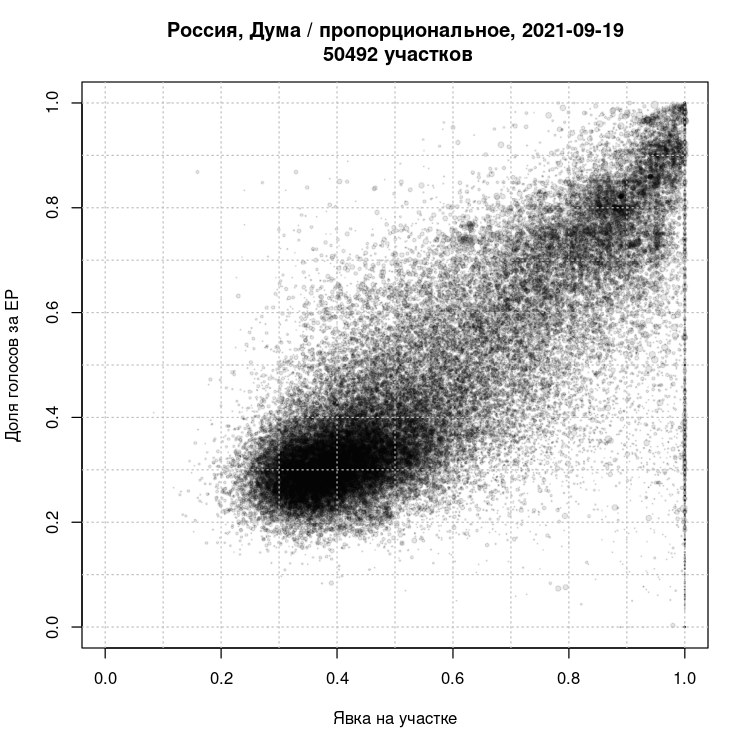
This has come to be known as the “comet” due to its shape, which, statisticians say is unnatural and a marker of possible falsification.
The fact it trails up to the top right in a clear linear trajectory with very strong correlation, they say, is the giveaway. (6)
The fact it trails up to the top right in a clear linear trajectory with very strong correlation, they say, is the giveaway. (6)

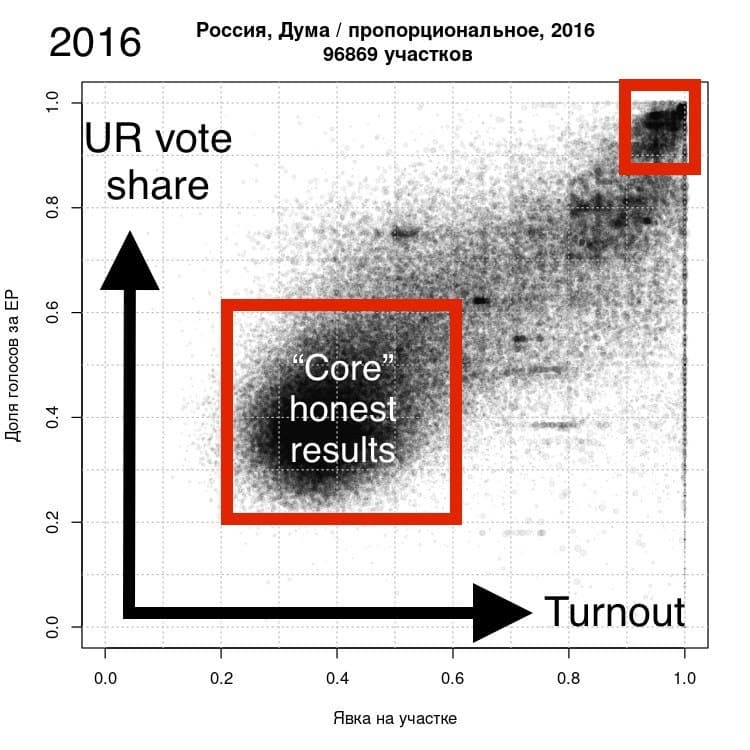
The big bulk of results where turnout is 30-40% and support for United Russia is 25-40% is seen as the “honest core” — the polling stations where, the analysis goes, there was likely no or little falsification. (7)

Polling stations in the very uppermost corner are the notorious 90-90 (or even 99-99) stations. 90% turnout, 90% for United Russia. That’s the likes of Chechnya & Tatarstan. (8)

In between these two boxes is a long linear trail. Almost as if, statisticians say, each extra vote (extra on top of what might be expected and the national average) logged in a polling station is almost certain to have gone to United Russia. (9)

In a fair count, the argument goes, there should be a much weaker correlation, a much messier graph, many more polling stations where turnout is high and UR support is low and also vice versa. (10)
For instance: If the average polling station is 35% turnout/30% UR, then it is strange that so many individual polling stations would be 85% turnout/80% UR, while so few are 85% turnout but 30% for UR. (11)
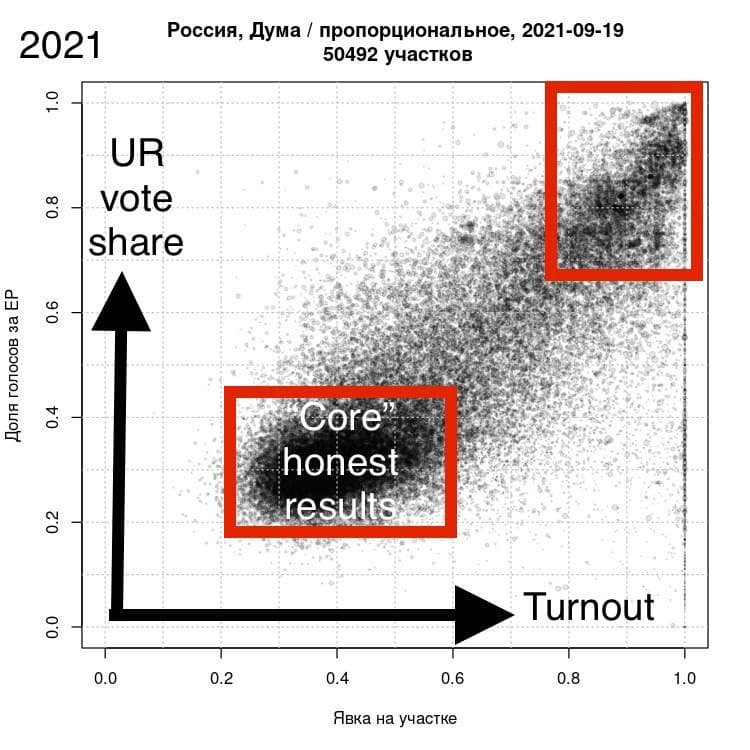
From these graphs, the numbers guys use the “core honest” individual polling stations to calculate what the “core honest” nationwide vote *should* be, had all polling stations had a result closer to that. (12)
Of course there will always be places where the real result might have been high-UR high-turnout, but the correlation should be much weaker. (13)
With this much data - across 50,000 polling stations in this analysis - the idea is to look at trends and estimates, which should wash away caveats or regional irregularities.
The estimates of falsification are also given in a broad range to account for this.
(14)
The estimates of falsification are also given in a broad range to account for this.
(14)
Based on this kind of preliminary analysis of about half the polling stations, Navalny ally Leonid Volkov estimated *half* - or 11-12 million - of all votes attributed to UR in these elections were falsified. (15)
t.me/leonid_volkov/…
t.me/leonid_volkov/…
Other statisticians have gone higher, estimating a third of *all* votes in the official results were not actually cast, with *3 in 5* UR votes deemed fake. (16)
facebook.com/boris.ovchinni…
facebook.com/boris.ovchinni…
The independent election monitoring NGO Golos (dubbed a foreign agent weeks before the vote in a bid to thwart their work) has also landed on the estimate of up to 30% of the votes being falsified (17)
meduza.io/episodes/2021/…
meduza.io/episodes/2021/…
Repeating the disclaimer: not my results, not an endorsement, just sharing the methodology
Source for the graphs I stole: facebook.com/alexei.koupria… (18)
Source for the graphs I stole: facebook.com/alexei.koupria… (18)
One final observation is the change in the “core honest” results from the last duma elections in 2016 to 2021. (19)


It becomes slightly more elongated and is hovering at a lower level. That suggests an overall decline in support for United Russia - something which opinion polls (both by independent and state-run pollsters) have long shown and predicted (20)
💻 A quick note on online voting.
Online votes were assigned their own polling stations in each constituency so can also be analyzed this way (they haven’t yet been included in this scatter for Moscow given the delay in results being published). (21)
Online votes were assigned their own polling stations in each constituency so can also be analyzed this way (they haven’t yet been included in this scatter for Moscow given the delay in results being published). (21)

Making conclusions about online is trickier though for many reasons.
1. The online and in-person cohorts are different, so the "core honest" online votes should yield different results (at the very least a much higher turnout) than the "core honest" offline votes. (22)
1. The online and in-person cohorts are different, so the "core honest" online votes should yield different results (at the very least a much higher turnout) than the "core honest" offline votes. (22)
2. The offline analysis works because you have the "core honest" box. If any online falsification was across the board - at *all* the "online polling stations" and not just some - it wouldn't show up in the same way, since there is no "core honest" group. (23)
For more on online voting: @PjotrSauer has a great pre-vote dive into how the move to online voting has raised fears it will make it both easier to falsify votes, and easier to cover up. (24)
themoscowtimes.com/2021/09/08/rus…
themoscowtimes.com/2021/09/08/rus…
There will be much more published on this in the coming days, but I wanted to highlight the basics here for anybody wondering where the figures of “12m” or “30%” fake votes come from. Not guesswork.
If you got this far, I refer you back to the disclaimers at the top (25)
If you got this far, I refer you back to the disclaimers at the top (25)
Bonus graph, without annotations.
This is the Communist Party scatter plot, same methodology.
See how their vote share trends down as turnout increases (the corollary of United Russia eating up all those polling stations with 80% turnout). (26)
This is the Communist Party scatter plot, same methodology.
See how their vote share trends down as turnout increases (the corollary of United Russia eating up all those polling stations with 80% turnout). (26)

And here's the "comets" for the last 4 duma elections:
2007: High support for UR & good turnout - "honest core" shows genuine popularity
2011: Lower turnout & support. 90-90 regions sticking out more.
2016: Partial bounceback
2021: New lows
2007: High support for UR & good turnout - "honest core" shows genuine popularity
2011: Lower turnout & support. 90-90 regions sticking out more.
2016: Partial bounceback
2021: New lows
https://twitter.com/tema57/status/1440229264733868033
• • •
Missing some Tweet in this thread? You can try to
force a refresh


