I think everyone is getting Evergrande backwards.
It's not what a default means for China. Rather it's what happened to China to cause a default.
Start with this chart. Economists are hacking China growth forecasts, and the downgrades are accelerating.
1/5
It's not what a default means for China. Rather it's what happened to China to cause a default.
Start with this chart. Economists are hacking China growth forecasts, and the downgrades are accelerating.
1/5

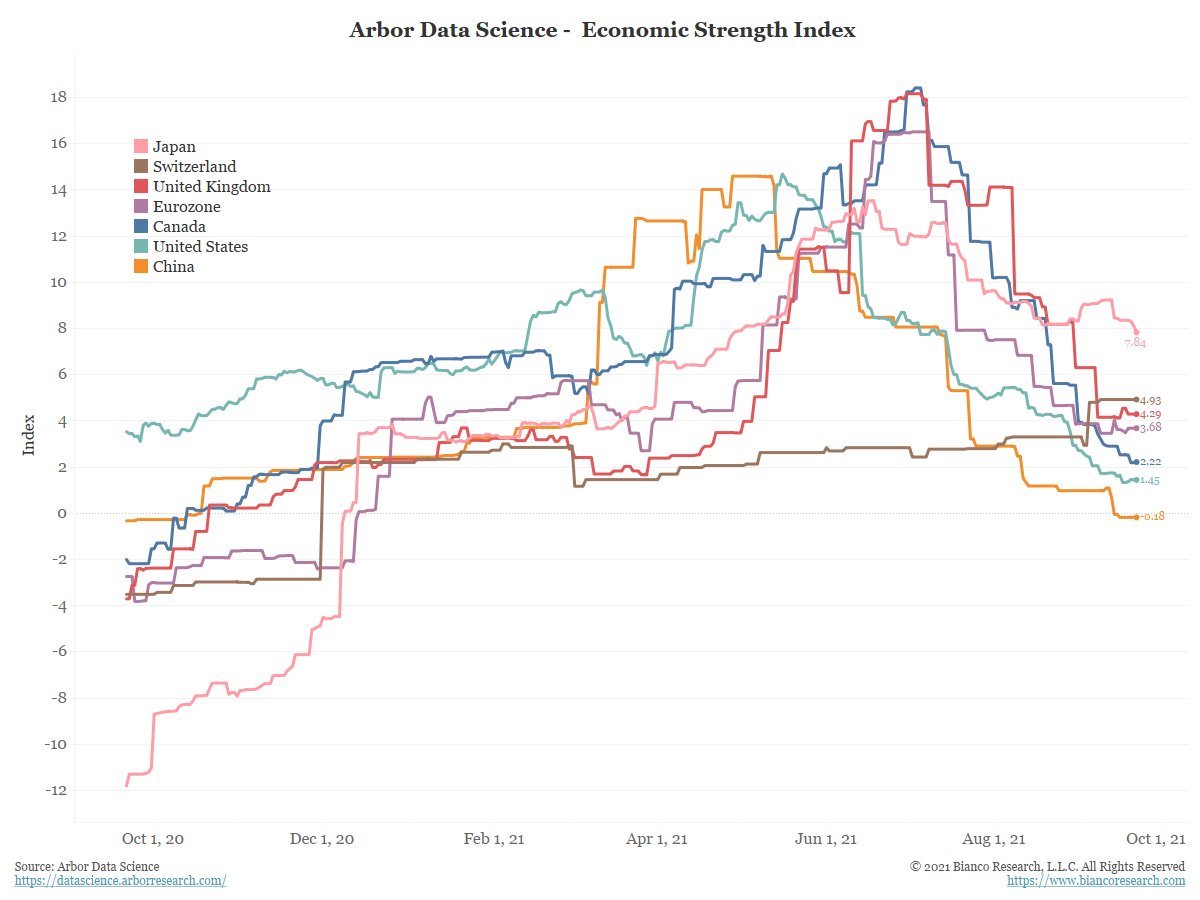
These downgrades are consistent with the Economic Strength Indices (ESI) compiled by our colleagues at @DataArbor . They measure incoming economic data versus its 1-year average.
China’s ESI has been falling and recently turned negative.
2/5
China’s ESI has been falling and recently turned negative.
2/5

Currently, China (orange) is the only large economy with an ESI below zero.
3/5
3/5
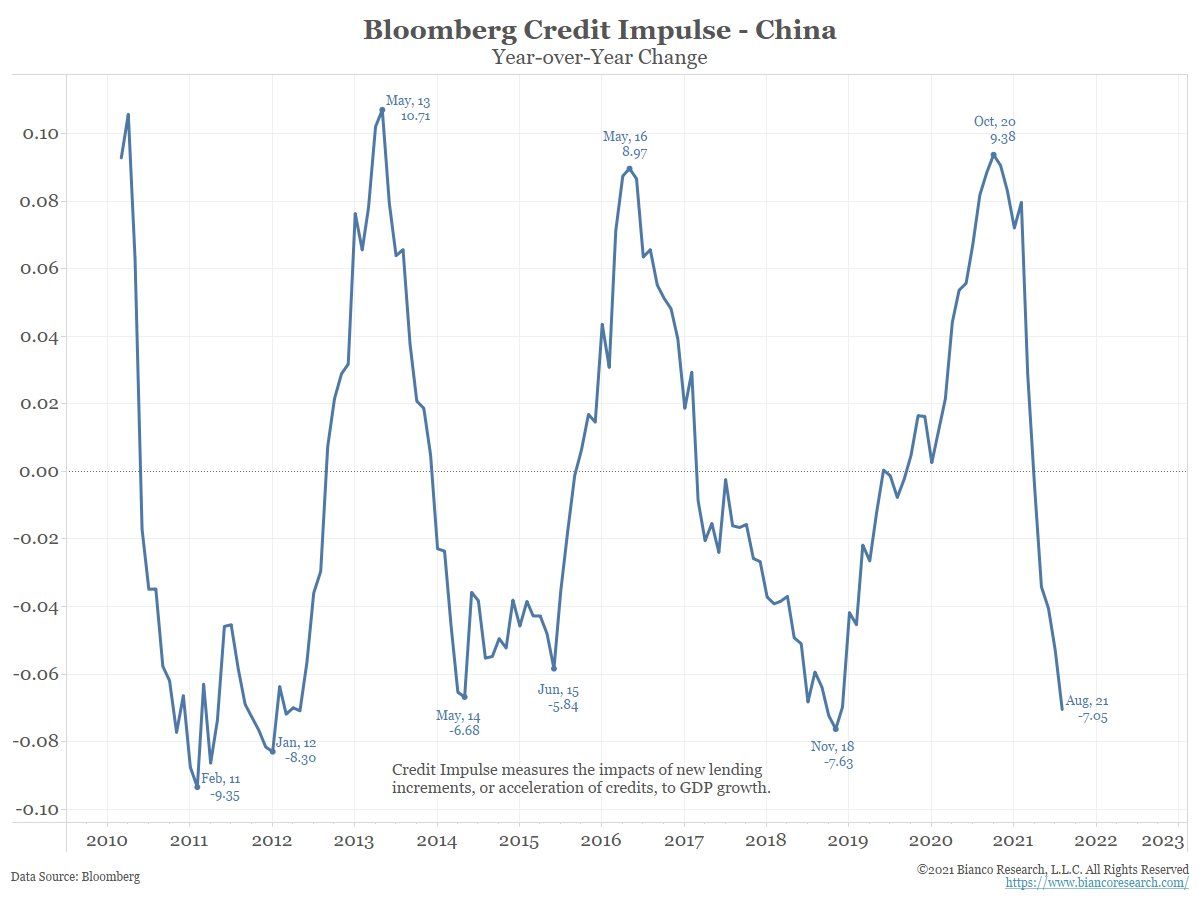
BB Credit Impulse Index.
It measures the change in household and non-fin liabilities (credit) divided by GDP. The Chinese economy is deleveraging, so it should come as no surprise that China’s largest (leveraged) property co, Evergrande (and junk credit), is in trouble.
4/5
It measures the change in household and non-fin liabilities (credit) divided by GDP. The Chinese economy is deleveraging, so it should come as no surprise that China’s largest (leveraged) property co, Evergrande (and junk credit), is in trouble.
4/5
The Chinese economy is hitting the skids hard. Their most vulnerable companies are in trouble and the government is cracking down on the private sector. The People’s Bank of China is injecting huge sums of liquidity into the economy, its most since January.
5/5
5/5

• • •
Missing some Tweet in this thread? You can try to
force a refresh