1/ The capsid is a strong protein structure that encloses and protects the viral genome. The most basic viruses will use a single protein produced many times to build the capsid. The more complex viruses will use multiple proteins to build their capsid structure.
2/ The basic structure of the viral capsid comes in 3 basic designs. They are Icosahedral, Helical and Complex.
3/ The Helical symmetry of capsids takes 1 protein and links them together into a very long string. That string is then wrapped into a helical structure like a tube.
4/ An example of a helical capsid virus is Ebola. This virus actually looks like a worm because of its helical capsid.
5/ The Icosahedral capsid is made up of triangles to form a sphere like shape. If you ever seen a 20 sided die from the D&D game, that is a perfect example of an icosahedral shape.
6/ The basic unit of the icosahedral capsid is a single viral protein often designated as Viral Protein 1 (VP1). Some viruses will use multiple proteins to form its basic triangle structure and will designate them VP1, VP2 and VP3.
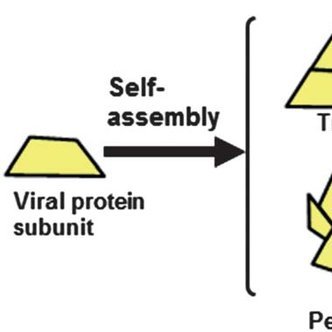
7/ This small structure is the most basic building block of the icosahedral structure. When 3 of these proteins come together, they form the basic triangle of the icosahedral capsid. The single triangle is called a facet.
8/ The most basic virus is made up of only 20 facets. This is also called its T number. A T-1 virus would have 20 facets. A T-2 virus would have 40 facets and a T-3 virus would have 60 facets.
9/ Since each facet is made up of the 3 basic proteins, the T number that represents the facets gets multiplied by 3 to find out the total proteins in the capsid. For example a T-1 capsid has 20 facets with 3 proteins per facet = 60 total proteins.
10/ A T-3 capsid would have 20 x 3 facets or 60 total facets with 3 proteins to make up every facet. That would be 60 x 3 = 180 total proteins.
11/ When a capsid falls into icosahedral symmetry, it will have specific shapes if forms. There are 2 fold, 3 fold and 5 fold axes in each 20 facet capsid.
12/ As the virus capsid gets bigger into the T scale, the number of 5 fold axes increase so that the capsid goes from a basic of triangle faces to pentagon shaped faces made up of these 5 fold triangles shown below.
13/ In a large enough capsid, you will begin to see 6 fold axes of symmetry. They begin to look like the pattern on a soccer ball.
14/ The last Capsid is the Complex which is made up of both helical and icosahedral parts. The classic example of this type of virus is the bacteriophage.
15/ The head of the bacteriophage is made up of a basic icosahedral shape which is attached to a long tube that is made up of a helical structure. These do not harm humans and prey on bacteria hence their names.
16/ The Adeno Associated Virus (AAV) is a basic T-1 icosahedral capsid. Its made up of 20 facets. The most basic uses only 1 protein VP1 with 60 copies to make up the capsid. Others will use 3 different proteins with VP1, VP2 and VP3 in 20 copies of each to build the capsid.
17/ The AAV capsid is the smallest you can find. It only holds about 4,500 bases (4.5kb) of RNA or DNA genetic material.
• • •
Missing some Tweet in this thread? You can try to
force a refresh
I built a framework to take my 30 years of experience at picking companies and turn it into a framework I could use with AI. This is just my DD. Please do your own.
Tech Framework:
Attribution: I built this framework using Microsoft Copilot while doing 3 AI prompting certificated from Google, IBM and Vanderbilt. I have used it with many AI agent effectively.
Fintech Framework
FINTECH INVESTMENT FRAMEWORK
Version 2.0 — Full System (Fundamental Score + Value Score + Red Flags + Competitive Landscape)
Total Structure: 0–10 Fundamental Score + 0–10 Value Score
I. FUNDAMENTAL SCORE (0–10 Points)
Each category uses a 0–2 or 0–1 scoring band.
Total possible = 10 points.
3. Profitability (0–2 points)
Measures: Unit economics, operating leverage, and earnings quality.
0 points: No path to profitability within 24 months
1 point: Clear path to profitability within 12–24 months
2 points: Already profitable with expanding margins
4. Competitive Advantage / Moat (0–1 point)
Measures: Structural defensibility.
0 points: Weak or no moat
1 point: Strong moat (network effects, switching costs, data advantage, regulatory advantage, ecosystem lock-in)
5. TAM (0–1 point)
Measures: Realistic economic TAM, not headline TAM.
0 points: < $1B
1 point: ≥ $1B
6. Management (0–2 point)
Measures: Management Quality
0 points: Credibility issues; poor governance; repeated execution failures.
1 point: Mixed track record; some execution gaps but generally competent.
2 points: Proven operators; strong capital allocation; transparent communication; consistent execution.
Fundamental Score Interpretation:
8–10: Category-defining, elite, investable
6–7: Solid, investable with conditions
4–5: Watchlist only
0–3: Avoid
II. VALUE SCORE (0–10 Points)
Direct translation of the biotech Value Score into business fundamentals.
1. Economic TAM (0–2 points)
Measures: Realistic revenue opportunity after adjusting for penetration, pricing, competition, and regulation.
0 points: Small or structurally constrained TAM
1 point: Good TAM with moderate runway
2 points: Massive, expanding TAM with long-term compounding potential
Any major red flag can override both scores and move a company to Avoid.
A. Business Model Red Flags
Structurally negative unit economics
CAC rising faster than LTV
High churn masked by aggressive acquisition
Overreliance on one product or customer
No pricing power
B. Financial Red Flags
Heavy dilution
Unsustainable debt
Low-quality revenue (one-time, non-recurring)
Aggressive accounting practices
C. Regulatory Red Flags (Fintech-Specific)
Capital adequacy issues
Regulatory investigations
Fraud exposure
Compliance failures
High credit risk without proper reserves
D. Competitive Red Flags
No moat
Race-to-the-bottom pricing
Entrants with superior economics
Losing share in a growing market
E. Management Red Flags
Overpromising
Inconsistent guidance
Poor capital allocation
Hype-driven communication
IV. COMPETITIVE LANDSCAPE ANALYSIS
Contextual layer to interpret scores.
1. Category Position
Leader
Challenger
Niche
Commodity
2. Moat Type
Network effects
Switching costs
Data advantage
Regulatory advantage
Brand trust
Ecosystem lock-in
Attribution: This used Google AI Studio and made in Markdown to maintain the formatting.
This is a comprehensive analysis of **SoFi Technologies (SOFI)** using the Fintech Investment Framework 2.0.
---
### **I. FUNDAMENTAL SCORE (9/10)**
**1. Revenue Growth: 2/2**
* **Analysis:** SoFi has consistently delivered adjusted net revenue growth above 25% YoY. While lending has slowed due to a conservative macro stance, the Financial Services and Tech Platform segments are growing at 30-40%+, maintaining a high total growth profile.
**2. 3–5 Year CAGR: 1/2**
* **Analysis:** Management guides for compound growth in the 20–25% range through 2026. While they have historically exceeded this, current guidance sits right on the border of 1 and 2 points. We score it a **1** to remain conservative regarding the maturing lending business.
**3. Profitability: 2/2**
* **Analysis:** SoFi achieved GAAP profitability in Q4 2023 and has maintained it since. Incremental margins are high, and the Financial Services segment recently turned contribution-profit positive, signaling significant operating leverage.
**4. Competitive Advantage / Moat: 1/1**
* **Analysis:** **Strong Moat.** SoFi possesses a "Financial Services Productivity Loop" (high cross-buy rates). Their **Bank Charter** provides a lower cost of capital (deposits) compared to non-bank fintechs, and **Galileo/Technisys** creates a vertical integration moat that competitors find hard to replicate.
**5. TAM: 1/1**
* **Analysis:** Massive. They are targeting the "HENRY" (High Earner, Not Rich Yet) demographic across all financial needs (Lending, Savings, Investing, Credit Cards) plus B2B infrastructure via Galileo.
**6. Management: 2/2**
* **Analysis:** CEO Anthony Noto is a proven operator (ex-Goldman, NFL, Twitter) with a clear focus on capital allocation. Communication is transparent, and execution on the transition from a "lender" to a "diversified fintech" has been consistent.
---
### **II. VALUE SCORE (7/10)**
**1. Economic TAM: 2/2**
* **Analysis:** SoFi is not just a student loan company anymore. They are capturing significant share in personal loans and checking/savings, with a long runway in home loans and credit cards.
**2. Revenue Durability & Predictability: 2/2**
* **Analysis:** High. Net Revenue Retention (NRR) is strong as members add more products. Transitioning toward fee-based and interest-income revenue from deposits makes the business less reliant on the volatile securitization market.
**3. Margin Structure & Operating Leverage: 2/2**
* **Analysis:** The "Productivity Loop" is working. As the Financial Services segment scales, the CAC (Customer Acquisition Cost) is offset by multiple revenue streams per member, leading to expanding consolidated margins.
**4. NPV per Share vs. Price: 1/2**
* **Analysis:** **Fairly Valued.** At current levels (typically trading between 1.5x–2.5x Tangible Book Value), SoFi is not "deep value." It is priced for its growth. It is "fairly valued" for an elite-tier grower but not yet "undervalued mispriced excellence."
**5. Dilution & Balance Sheet Risk: 0/2**
* **Analysis:** This is the weak point. SoFi has a history of heavy Stock-Based Compensation (SBC) and has used convertible note offerings that risk future dilution. While the balance sheet is strong (well-capitalized bank), the share count creep is a persistent drag.
---
### **III. RED FLAGS (Override Check)**
* **Business Model:** None. Unit economics are positive.
* **Financial:** **Moderate Concern (Dilution).** High SBC remains a point of contention for shareholders.
* **Regulatory:** **Low/Medium Risk.** As a bank, they face intense OCC/Fed scrutiny. Any capital adequacy issue would be a major red flag (none currently).
* **Competitive:** High competition from JP Morgan and digital-native neobanks, but SoFi is currently winning share.
**Portfolio Implication: High-Quality / Monitor for Entry.**
SoFi is a category-defining fintech with elite fundamentals. However, because the Value Score is hampered by dilution and a valuation that reflects much of its current success, it sits in the
**"Monitor/Core Holding"** category.
**Recommendation:** A priority buy on any macro-driven pullbacks that push the Value Score into the 8–10 range (specifically if the price approaches 1.2x–1.5x Tangible Book Value).
Note: I agree with this valuation. Many over hyped investors claim this is a $30 or higher company, but the real value is in the mid to upper teens. Its just fairly valued here around $16.
Its my desire to build a master thread and then put it on my highlights for sharing my 30 years of investing research framework for Biotech companies. I consider Fundamentals tell me what to buy. Its a measure on company quality. Valuation tells me when I should buy. It tells me If I am overpaying or getting a bargain on buying any company. Combining fundamentals, valuation and patience has done very well for me in investing for many years. I am sharing this to give you my framework so that it may inspire you in building your own framework.
The Fundamental Framework:
Fundamental Score (0–10): Full Criteria
A 6‑category rubric, with 4 categories scored 0–2 and 2 categories scored 0–1, for a maximum of 10 points.
1. Science & Platform Strength (0–2)
2 points — Strongly differentiated science; validated or de‑risked mechanism; platform can generate multiple assets. Think RNAi or ADC like technologies that lead to multiple big drugs.
1 point — Plausible, partially validated science; some differentiation; platform potential but unproven. Think one hit wonders or early stage concept companies with unvalidated technology.
0 points — Weak or non‑differentiated mechanism; unclear biology; no platform leverage.
2. Pipeline Depth & Breadth (0–2)
2 points — Multiple credible shots on goal; diversified by indication, modality, or stage; clear sequencing strategy.
1 point — Some pipeline depth but concentrated risk; limited diversification.
2 points — Strong, consistent, statistically meaningful efficacy and safety; reproducible across cohorts or studies. Best in Class data, First in Class mechanism or Breakthrough Therapy is a strong sign.
1 point — Early or mixed data; promising signals but not yet robust.
0 — Weak, inconsistent, negative, or unsafe data.
4. Management Quality & Execution (0–2)
Follow what they promise and then what they actually deliver. Take notes on calls and make sure they live up to what they promise.
1 point — Realistic economic TAM ≥ $1B for the company’s actual monetizable opportunity (pricing, reimbursement, share, duration, competition). Make sure to consider partners take.
0 points — Economic TAM < $1B or structurally constrained.
6. Cash Runway & Balance Sheet (0–1)
1 point — At least 2 years of cash runway at current or reasonably projected burn; low near‑term dilution risk.
0 points — <2 years runway or high likelihood of near‑term, punitive financing.
The Valuation Framework:
I use a sum of the parts valuation. This requires me to value each drug one by one. Then I add in the cash and subtract the debt. I then divide my market cap calculation of all the parts by the outstanding share count. The shares out can be found on the latest 10Q or 10K at bottom of first page.
There are 2 key numbers I use in calculating the value of each drug. The first is I need the peak sales for each indication. That can come from an average of analysts estimates, or I can take the numbers from the company they give out during conferences and calculate peak sales myself.
The other number is the multiplier. This is determine through many years of watching companies price assets through acquisitions and market reactions to success and failures of programs. I use .1x for anything with no phase 1 data yet. 1x for clean phase 1 data, 2x for good phase 2 data, and 3x for good phase 3 into early commercial. Most late stage buyouts happen at 3x peak sales estimates. Its not perfect, but it gets me in the right ballpark.
Once I have the value of each drug with each indication, I add them up with cash and subtract the debt.
This is my updated profile for Viking. They are 1 of my 5 Innovators. They are in the mid stage and moving into later stages of development. They have some validation, but still a long way to get across that finish line.
Management:
Intro to Management:
I have been following this company on and off for several years, so I know the management well. So far, I had time to catch up on the company by listening to several of their webcasts and presentations over the last few months. I have been impressed with their management team thus far. There are a few key areas of business that I think a management team has to demonstrate expertise in to build a long term winning biotech company.
Clinical Development:
They need expertise at advancing drugs through the clinical development process. So far, the company has advanced two programs through the end of phase 2 with MASH and Obesity. That shows they have some ability to move through clinical development but still have a way to go before reaching successful approval. They should be starting a phase 3 soon for the subcutaneous injection in obesity in Q2 of 2025. The oral phase 2 study should start in second half of 2025.
Regulatory Development:
They need expertise at navigating the regulatory process with the FDA. So far, they haven't had to deal much with the FDA. They are just starting phase 3. It will take some time before they get to that point. We will have to wait and see how it goes.
Managing Balance Sheet:
They need expertise at managing the balance sheet. They have $853 million in cash and no debt. They burned about $52 million in their Q1 quarter. Their costs will ramp as they advance into phase 3. They just signed a deal for manufacturing which included $150 million over the next 3 years. They also started a buyback for $250 million. I don't think that is a wise choice when they need cash to run phase 3 trials and build a commercial sales team. I am watching their cash flow statements, and I have not seen any buying of their stock yet. I think they know better.
Commercial Sales:
The final key expertise for a management team is the ability to build a successful commercial sales team. So far, they have no commercial products, and they are still quite a way from being commercial. We will have to see if they decide to partner or go it alone with commercial sales.
Future Potential:
VK2735:
Mechanism of Action:
This is novel dual agonist of the glucagon-like peptide 1, or GLP-1, and glucose-dependent insulinotropic polypeptide, or GIP, receptors. It is being developed in both oral and subcutaneous formulations for the potential treatment of obesity.
Obesity Data:
The Venture study was a phase 2 study for VK2735 subcutaneous injection vs placebo for 13 weeks. It was once weekly injections for obese patient greater than 30 BMI or overweight with greater than 27 BMI. The placebo adjusted weight loss over 13 weeks was 13.1%. Up to 88% of patients on VK2735 had at least a 10% weight reduction versus only 4% on placebo. Next steps are the planning of the phase 3 study for subcutaneous formulation in 2025.
The phase 1 study for the Oral formulation finished up in 2024. This was a safety and efficacy study for 28 days for the oral dosing. Weight reductions were seen reaching up to 5.3% over the 28 days. This compares with the 6% shown in the 28 day study of the subcutaneous formulation. They just started the phase 2 study of the oral formulation in early 2025.
The phase 3 trial is ramping up to start and should be started by the end of Q2 of 2025.
The phase 2 Venture study for Oral formulation is fully enrolled and should read out data in second half of 2025.
Obesity Competitive Landscape:
The competitive landscape for Obesity is intense. There are two major big pharma players with Novo Nordisk and Lilly. Then there are a dozen or so other companies competing to get a slice of the market. The move is away from injectables and toward oral formulations. So far, Viking has one of the best oral data sets.
Obesity Market Size:
There are over 100 million Americans living with Obesity which is nearly half of the adult population. This market is expected to grow to over $100 billion sales by 2030. There is a lot of room for competition as the biggest limiting factor for proteins is manufacturing. Viking singed a manufacturing deal for $1 billion oral doses which comes out to about 2.74 million patients treated with a once daily dose per year. That would support about $5.4 billion in sales.
VK2809:
Mechanism of Action:
This drug is designed to be an agonist of the Thyroid Hormone Receptor Beta (TRB) that possesses selectivity for liver tissue, as well as the beta receptor subtype, suggesting promise for the treatment of metabolic disorders, including Metabolic dysfunction Alcoholic Steatohepatitis(MASH) and Non-Alcoholic Steatohepatitis (NASH).
MASH Data:
The Voyage study was a phase 2 study of VK2809 in NASH/MASH with fibrosis stages F1 to F3. The primary endpoint was change in liver fat assessed by MRI. The study was a measure from baseline to 12 weeks with biopsies at 52 weeks of treatment. The data showed that up to 75% of patients had MASH/NASH resolution compared to 29% on placebo. They also showed that 57% of patients had greater than 1 stage improvement in their fibrosis.
MASH Competitive Landscape:
This drug will compete with Madrigal's drug which has the same mechanism of action and is already on the market. The data support Viking with the better in class data. That should give them a strong competitive edge.
MASH Market Size:
There are estimated to be around 315,000 patients which would be the population for this drug. With a comparable cost to Rezdiffra, they could do at least $1 billion in sales and maybe two or three times that amount depending on competition and pricing. I am currently using $1 billion in my estimates for now.
Over the weekend, I spent a ton of time picking through the $NBI and $ARKG looking for ideas. I shared my comments on many, but not all the companies I looked at. Here is a list of links to those threads.
They have 35 holdings in the $ARKG and I am going to look at them all and give you my opinion.
$TWST is a DNA company that makes and sell DNA sequences to biotech companies. I don't see them becoming a very huge company. I think the potential is actually small. One of the reasons I sold them when I really got to know the company.
$RXRX I owned for a few years but recently sold them as I felt the company had a few issues that needed to be fixed like sticking with a failed drug, not allowing analysts to ask tough questions, and the constant insider selling. I would rather wait for them to prove me wrong before I risk my money as I got too many other good ideas.
There was a lot of hype over the FDA announcement for replacing animal testing with AI modeling over time. A lot of the companies in the TechBio space rocketed higher yesterday. The market is not smart enough to know the winners and losers. It paints with a broad brush. My plan over the coming weeks it does dig into these TechBio companies. This has been a major theme of mine for years now. With all my study of the space, I will be able to help you sort the winners from the pack.
Here is the link to the FDA announcement where they are going to replace animal testing with alternatives over time. That is right. The huge pop in the TechBio names seems to be very premature. Nothing it going to change right away.
They are going to be replaced with AI based models of toxicology. This means the digital chemistry companies will be driving this technology both Big and Small. These will be companies like $SDGR, $RXRX, $TEM, $ABSI Insilico, GenerateBio, Asimov and Iambic