Is finishing up quite a fat season by modern standards, even though it will only have been above the average curve for two weekly measures.
Gain and loss:
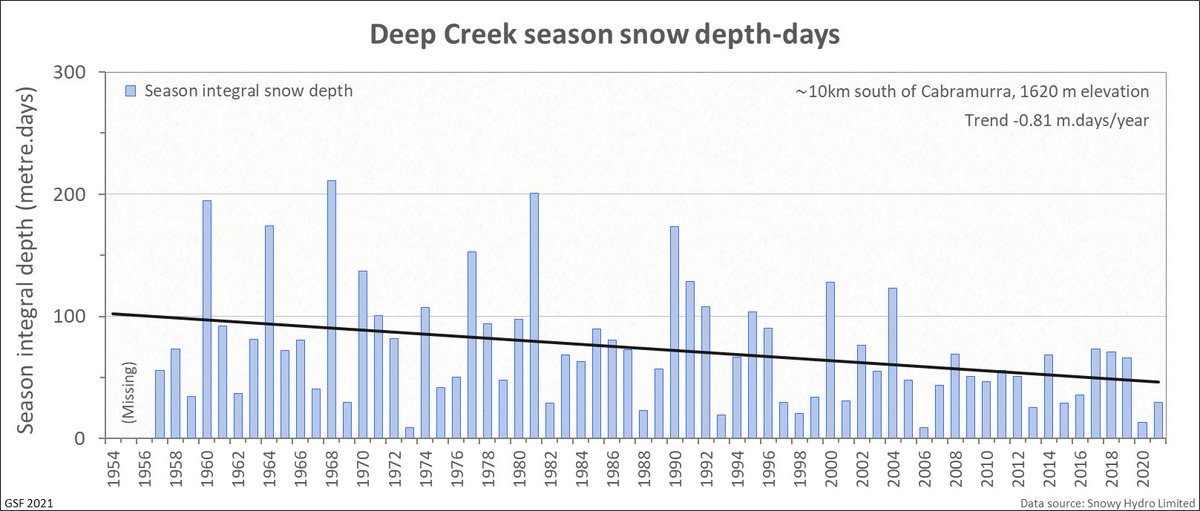
Deep Creek with one more little blip.
...And Three Mile Dam without.
Kosciuszko has a pretty sad snow cover downtrend now at mid-altitudes. (This is season integral depth == snow depth in metres times the number of days it was there.)
Can plot similar for Three Mile Dam, a low altitude snow measurement site in northern Kosciuszko (near Selwyn). It is more erratic, but if anything the recent decline is worse.
Over the last ~20 years, the bigger seasons have vanished!
• • •
Missing some Tweet in this thread? You can try to
force a refresh
Perhaps the least noticed and most troubling feature of Australian politics in recent years has been the strong influence, if not quite takeover, by small, secretive, mad-right religious groups:
The Penecostals -- Morrison and a dozen others in the Victorian and WA Liberals.
The weird-right Opus Dei Catholics – the Perrottets and hangers on in the NSW Liberals.
Sundry nutty evangelicals, also in WA – Porter.
And the radical Zionist Judaism controlling the Labor Party – Leibler, Dreyfus, many others; apparently a few 'teal' independents too.
Opaque, tiny groups running our politics cannot be a good thing, regardless of your views on their strange religious positions (or of interventionist religion in general).
One more data point on the CERES radiation balance, for March 2024. Why this isn't now front-centre in climate monitoring, no idea. Best interpretation: it's somehow erroneous, but no one yet has even begun to suggest how. Worst interpretation: it's real, and we're fkd.
The difference between those two traces -- the planetary net flux -- looks like this, monthly seasonally adjusted. The trend +1.56 W/m² (incoming positive) is a simply ridiculous number, as is its rapid rise over the last 20 years.
Why this growing divergence, below? Because the rapid terrestrial carbon sink is collapsing, a recent paper argued. And what would 'terrestrial sink collapsing' entail, given the paper's adopted definitions of emission and sink? Main candidate: WILDFIRE.
But the really big increase in wildfire emissions from vegetation regime change (definitionally, 'decreasing terrestrial carbon sink') looks to be in the northern conifer - boreal - taiga:
Mr Dutton has chosen Callide in Central Queensland as one of his putative 'locations' to build Federal Government nuclear power stations. Since I personally designed a number of the surface facilities on this site, thought you might be interested in a run-through.
It's a congested, hilltop site. There are three power stations, two of which still operate, sometimes -- Callide B and Callide C. Despite being separately owned, the generators for those two are actually co-located in the same extended shed.
Why is it so? To get far there you'd first have to admit that the misfit is real, and the modelling community is still clutching it's 'uncertainty band' pearls, and denying the appropriateness of non-linear observational models.
It's correct that the IPCC 'middle projections' carry substantial uncertainty, but those are the numbers, right there in the great big report (Table SPM.1, below). It's odd that no one much bothers to refer to them.
Here's the two graphs to the same scale, for direct comparison:
And there's the Gaza War Cemetery, northern outskirts of Gaza City, where 111 Australians are buried. It's not clear whether Israel has bombed or bulldozed it yet. vwma.org.au/explore/cemete…
Looks intact, though there's been bombing very close, and there's extensive bulldozing around it in the latest image: . The grass needs mowing. apps.sentinel-hub.com/eo-browser/?zo…