Alright, how wants some fun analysis on Santander bikes? Image
@TfL has a great API and I have been polling it for almost two weeks now to get the detailed status.

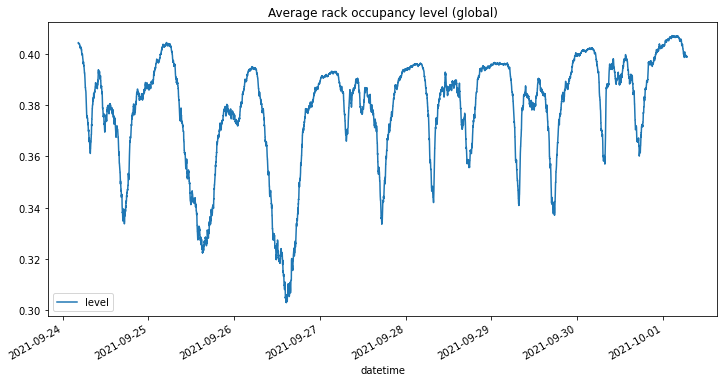
Firstly, there are almost 21,000 docks but only 8,000 bikes, so max dock occupation is 38% Image
What surprised me that peak usage of the bikes is actually not that massive. Even at the lowest level of availability there were only 2,000 of the 8,000 bikes in use Image
usage patterns on the other hand are not surprising: big and sharp peak in the morning and in the evening, and constant drawdown during the day with a slight peak during lunch Image
one thing that was slightly bizarre was that for 4 days last weak the night peak was about 200 bikes short (10% of peak utilisation). Who was hogging the bikes at night?!? Image
Any. So whilst the over volatility in occupancy is not that much, on any individual station it is usually massive. Here Gloucester Road for example Image
So how often is a station "impaired", ie empty or full? Full, not that often. 200 stations never get full, and even the worst ones are full only 40% of the time Image
Who are those stations I here you asking? here we go -- all stations that are full more than 20% of the time Image
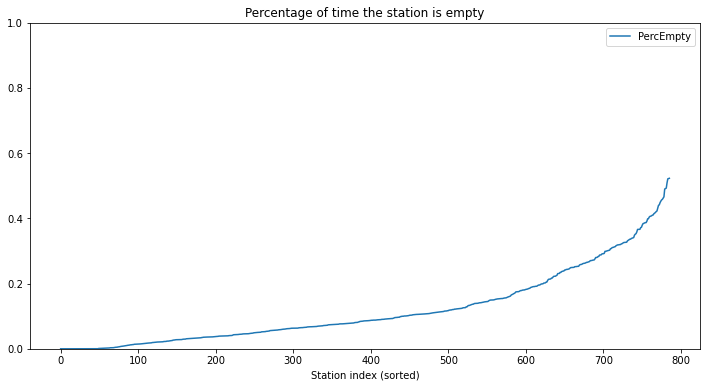
Empty is a different story -- less than 100 stations are never empty, and whilst the peak is also about 40-50% a lot more stations are in this area Image
those are the stations -- Kensington, City, tourist areas Image
Here the geo plot of this data -- the darker the more often the stations are empty Image
The same for full stations -- it evened a bit out over the last week, but in the first few days there was a massive rim at the south boundary Image
(I started collecting data at a weekend, so my guess is that people use the bikes to drive home as far as they get and walk the rest)
Here for example the chart for Sunday the 19 September, at 4:32 BST (3:32 UTC in case you are wondering) Image
one important context though: if a station is “only” empty 40pc of the time this typically means “there are bikes available at night”
for example my local station — the reason why I started all this — generally starts emptying at 730 and is empty by 830. by 930 some bikes are back.

TLDR: percentages do not tell the full story
rack occupancy at 17:34 vs occupancy now (23:17) ImageImage
so essentially people moved out from the center to the periphery (and to the train stations)
plenty of bikes available... Image
despite the weather some people are out there... Image
but then we see that by and large Londoners don't like the rain -- a lot less cycling today... Image
they do however come out now, at least in the High Street Kensington area... Image
yesterday vs today, both 12:25 BST; clearly a lot more going on in the centre when the weather is nice... ImageImage
however, last night vs today shows that there still was some movement into central London ImageImage

• • •

Missing some Tweet in this thread? You can try to force a refresh
 

Keep Current with Oscar D Þorson

Oscar D Þorson Profile picture

Stay in touch and get notified when new unrolls are available from this author!

Read all threads

This Thread may be Removed Anytime!

PDF

Twitter may remove this content at anytime! Save it as PDF for later use!

Try unrolling a thread yourself!

how to unroll video
  1. Follow @ThreadReaderApp to mention us!

  2. From a Twitter thread mention us with a keyword "unroll"
@threadreaderapp unroll

Practice here first or read more on our help page!

More from @odtorson

2 Oct
Continuing from yesterday’s thread on Impermanent Loss, and in particular IL for leveraged AMMs

as a recap, the Uniswap v3 style levered AMM is using the regular k=x*y curve, but it restricts it to a particular range Image
restricting it to a specific range a priori significantly reduces IL, eg to about 2pc for a 60…140 range.

However, this effect is undone by removing collateral that can’t be traded out of the AMM and IL is percentage of levered liquidity is high.
Read 12 tweets
1 Oct
I am working on paper on Impermanent Loss, and I want to put a few thoughts out here to get them sorted before the paper proper is published
quick reminder: Impermanent Loss is what happens to you when you provide liquidity in an AMM, and it usually is everything but impermanent
IL is generated because an AMM sells the outperforming asset and buys the underperforming asset, so you miss out on the moon shots, but you are fully invested all the way down...
Read 31 tweets
30 Sep
that’s an interesting ask — allow us to bring staff over for up to 6 months a year without requiring a visa. sensible at first sight, but….
in the new age of Zoom working, 6 months a year is essentially local staff. the obvious benefit here is nearshoring: employ staff in low cost locations but bring them over regularly
here I think the point is different though: keep your local coverage staff local to comply with regulations, and bring them over to London every other week to catch up with the wider team
Read 4 tweets

Did Thread Reader help you today?

Support us! We are indie developers!


This site is made by just two indie developers on a laptop doing marketing, support and development! Read more about the story.

Become a Premium Member ($3/month or $30/year) and get exclusive features!

Become Premium

Too expensive? Make a small donation by buying us coffee ($5) or help with server cost ($10)

Donate via Paypal Become our Patreon

Thank you for your support!

Follow Us on Twitter!

:(