$500,000,000.
Half a billion dollars.
Currently, this is how much of $SPX index needs to be bought or sold for every 1% down or up move, respectively.
These flows are a result of a substantial options trade that was placed yesterday.
Let's have a look at what's going on 👇
Half a billion dollars.
Currently, this is how much of $SPX index needs to be bought or sold for every 1% down or up move, respectively.
These flows are a result of a substantial options trade that was placed yesterday.
Let's have a look at what's going on 👇

This bank has an Asset Management unit.
One day, they embarked on a noble mission to help investors who might be concerned about a market correction.
Since many investors are, it looked like they could offer an attractive product.
And so, they launched a fund.
One day, they embarked on a noble mission to help investors who might be concerned about a market correction.
Since many investors are, it looked like they could offer an attractive product.
And so, they launched a fund.
The fund provides a much-needed exposure to S&P 500 index and a few other large-cap US stocks.
But there's a twist.
(I mean, for a 60 bps management fee - there should be f*cking a twist!)
But there's a twist.
(I mean, for a 60 bps management fee - there should be f*cking a twist!)
The fund also seeks to hedge its exposure and ensure investors' safety in case of a market crash.
And given that no one knows when the market will crash (including the "$4,999 per course" stock market gurus), the bank decided to hedge its portfolio systematically.
And given that no one knows when the market will crash (including the "$4,999 per course" stock market gurus), the bank decided to hedge its portfolio systematically.
So how can they hedge?
The most obvious way is to buy a put option.
And then another one, when the first one expires.
The most obvious way is to buy a put option.
And then another one, when the first one expires.
But this is really expensive!
Especially when the typical systematic long put strategy (a.k.a. "long-vol") looks like this:
Especially when the typical systematic long put strategy (a.k.a. "long-vol") looks like this:
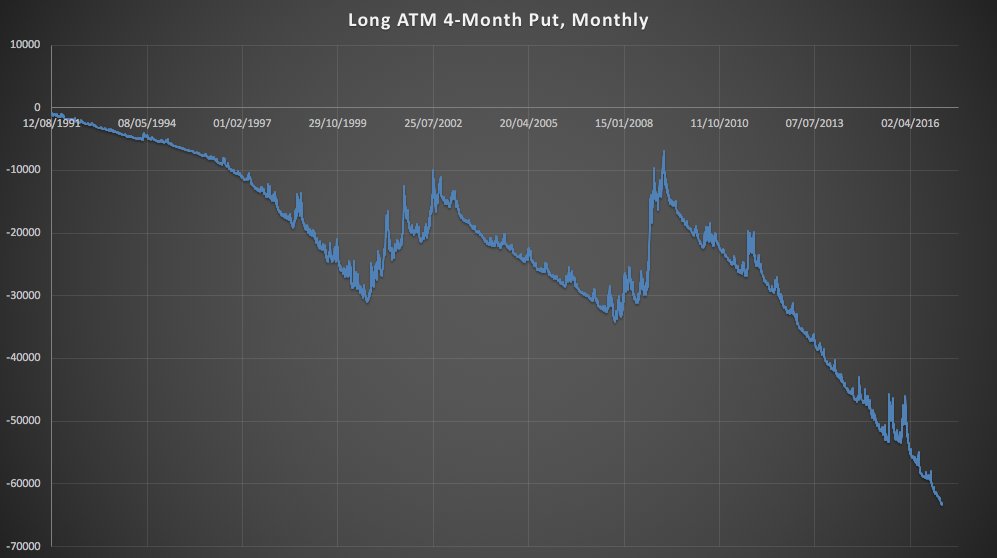
No bueno...
Is there a way to make it cheaper?
Well, a put option pays out all the way down to zero...
Maybe investors don't need THAT MUCH protection, right?
Let's cap it!
Is there a way to make it cheaper?
Well, a put option pays out all the way down to zero...
Maybe investors don't need THAT MUCH protection, right?
Let's cap it!
The strategy can be turned into a put spread by selling another put option with a lower strike.
It can still offer sufficient protection but will be cheaper than a stand-alone put - especially if the skew is steep, as it is now.
So the fund went along with a put spread.
It can still offer sufficient protection but will be cheaper than a stand-alone put - especially if the skew is steep, as it is now.
So the fund went along with a put spread.
But then someone at the fund's headquarters said:
"Hold on! We still need to pay for this spread!? What is this nonsense!?
What if - and hear me out - what if we made it completely free? Zero cost!
Investors would love that!"
And that’s what they did.
"Hold on! We still need to pay for this spread!? What is this nonsense!?
What if - and hear me out - what if we made it completely free? Zero cost!
Investors would love that!"
And that’s what they did.
One way to make it free is to sell more options against it.
And since they already sold a put against their long put, the other potential solution was to sell a call.
And since they already sold a put against their long put, the other potential solution was to sell a call.
The call strike is then selected to make the whole structure zero-cost - i.e. the premium received from a short call is the same as the premium paid for a put spread.
The overall structure is known as a "seagull" within the FX derivatives world due to its resemblance to the bird.
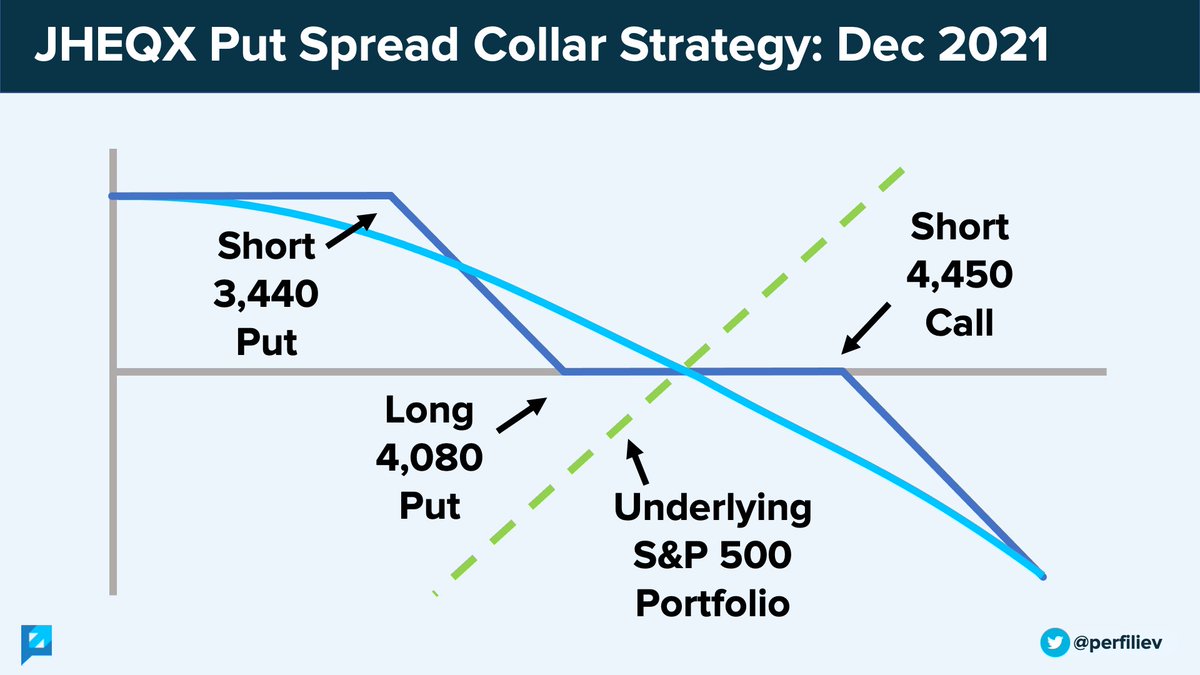
Along with a position in the underlying index, this can also be referred to as a put spread collar (which also looks like a seagull 🙂)
Along with a position in the underlying index, this can also be referred to as a put spread collar (which also looks like a seagull 🙂)
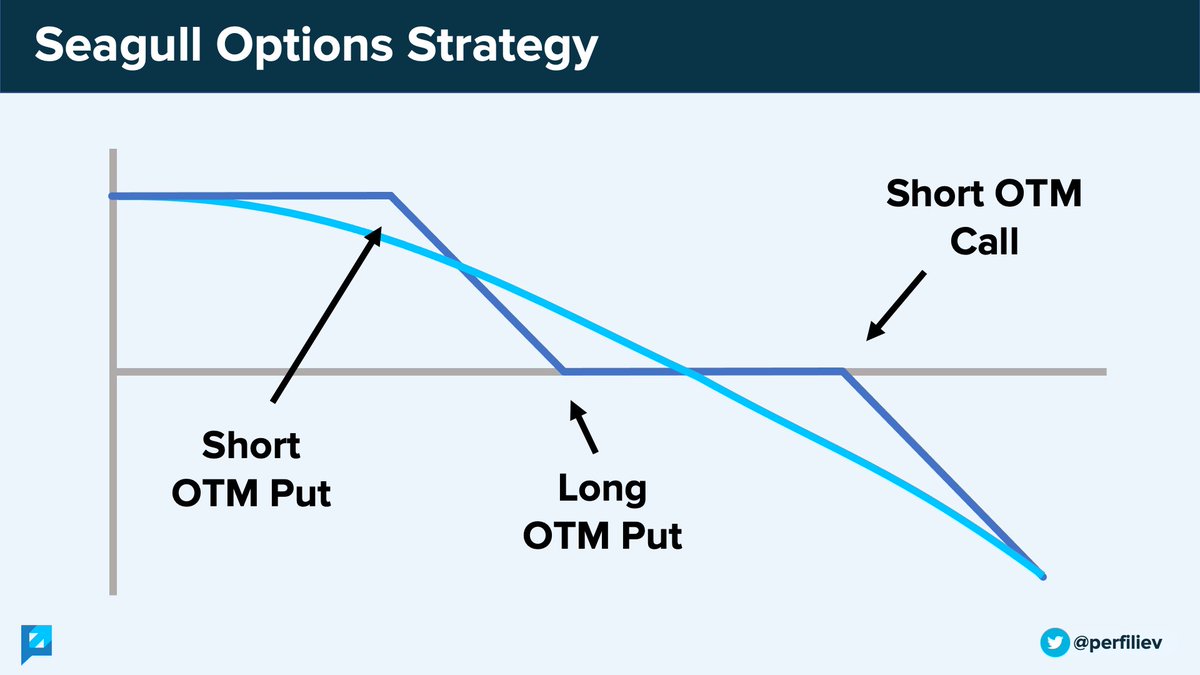
In our particular case, the options strategy costs zero to enter and gives an illusion of free insurance.
The free insurance is paid for by the short call, which entirely limits the fund's upside.
The free insurance is paid for by the short call, which entirely limits the fund's upside.
If (when?) stocks rise, the losses on the call will offset the gains on the equity position, and investors will miss out on the Fed's endless merry-go-round of economic stimulus, QE and new ATHs.
Now, why should we care about any of this?
Because size matters! (At least, in this particular case)
The strategy is traded in significant volume, and that has implications for the broader market.
Because size matters! (At least, in this particular case)
The strategy is traded in significant volume, and that has implications for the broader market.
The fund trades this strategy every three months, using $SPX quarterly options (i.e. the ones that expire on the last day of each quarter).
Yesterday was the end of Q3.
The fund's Q3 strategy expired and was rolled over to Q4.
Yesterday was the end of Q3.
The fund's Q3 strategy expired and was rolled over to Q4.
If yesterday we looked at the option chain for 30 September 2021 expiry, we would see the following data for these strikes - 3,425 put, 4,065 put and 4,430 call: 
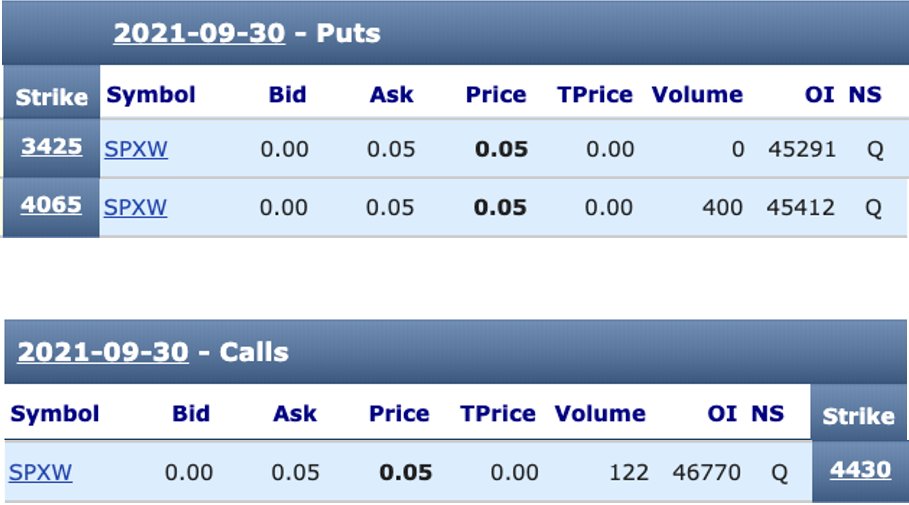
Note that the Open Interest (OI) is a massive ~45,000 contracts!
That's higher than the second most popular option - a 4,000 strike put with ~30,000 contracts outstanding! (we love round numbers, right? :))
That's higher than the second most popular option - a 4,000 strike put with ~30,000 contracts outstanding! (we love round numbers, right? :))
As it was expiring yesterday, the whole #FinTwit patiently waited for the fund to roll the strategy over to December 2021.
And they didn't disappoint!
And they didn't disappoint!
https://twitter.com/perfiliev/status/1443612032348086278
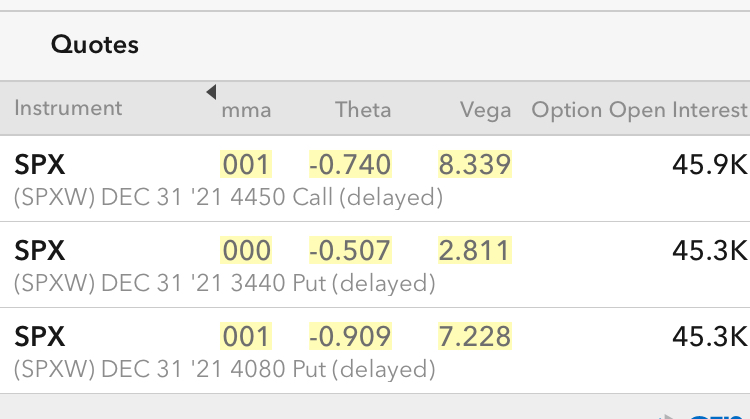
The strategy was eventually rolled to 3440/4080/4450 strikes, with the same OI of ~45,000 contracts.
This can be seen in the 31 December 2021 option chain:
This can be seen in the 31 December 2021 option chain:
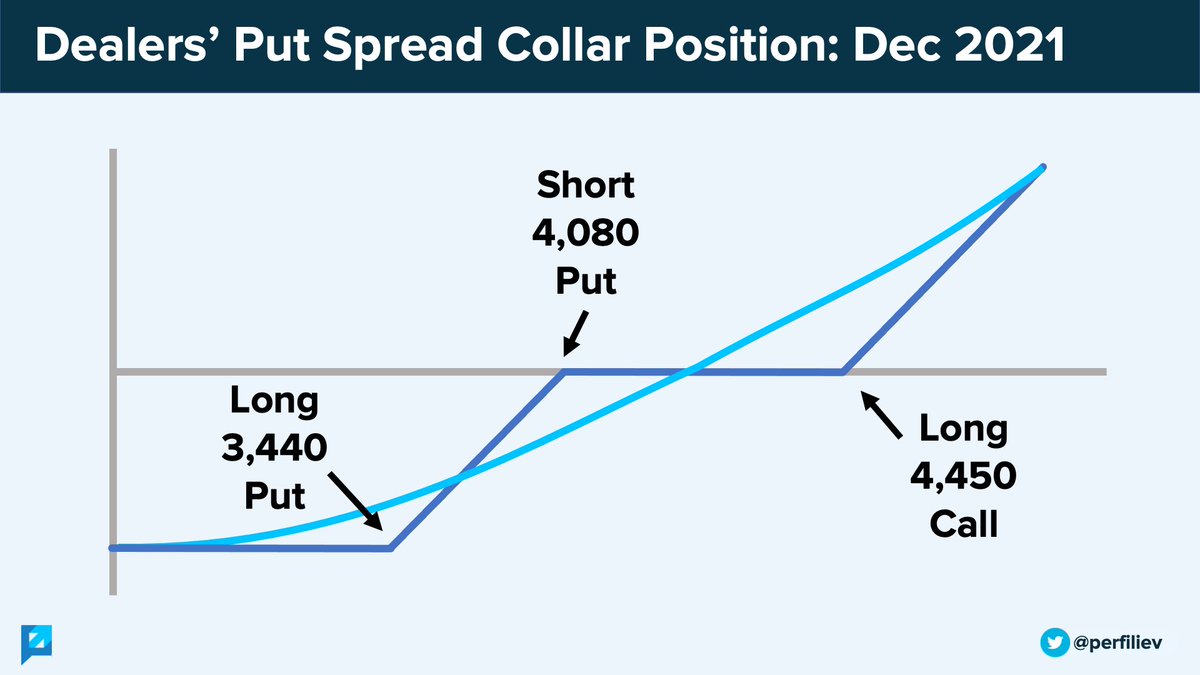
And, unlike the fund, the dealers don't want this risk - they have to delta hedge it.
At initiation, the strategy delta was around 0.55 - negative for the fund and positive for market makers.
This means the dealers have to SELL around 0.55 worth of $SPX delta against this trade
At initiation, the strategy delta was around 0.55 - negative for the fund and positive for market makers.
This means the dealers have to SELL around 0.55 worth of $SPX delta against this trade
How much is that exactly?
That's an excellent question - thank you for asking!
The options contract size is $100 per SPX point.
So the exposure per one unit of strategy is:
0.55 * 4307 (yesterdays $SPX close) * $100 = $236,885
That's an excellent question - thank you for asking!
The options contract size is $100 per SPX point.
So the exposure per one unit of strategy is:
0.55 * 4307 (yesterdays $SPX close) * $100 = $236,885
And given that there are approx. 45,000 contracts outstanding, we have:
$236,885 * 45,000 = $10.6 billion.
Hence, the market makers need to SELL almost 11bn worth of $SPX to hedge their delta resulting from this options trade.
Not trivial!
$236,885 * 45,000 = $10.6 billion.
Hence, the market makers need to SELL almost 11bn worth of $SPX to hedge their delta resulting from this options trade.
Not trivial!
And the fund knows that!
They understand the potential market impact from this single transaction.
This is why yesterday, they didn't just open the Dec21 strategy outright but traded an ITM call along with it!
To ease the pain, so to speak...
They understand the potential market impact from this single transaction.
This is why yesterday, they didn't just open the Dec21 strategy outright but traded an ITM call along with it!
To ease the pain, so to speak...
Again, if we went back yesterday and looked at the 30th September expiry, there was a call with an OI of 25,809 - at 4150 strike.
This was a 1-day ITM call that was bought to open, along with the rest of the Dec21 strategy.
This was a 1-day ITM call that was bought to open, along with the rest of the Dec21 strategy.
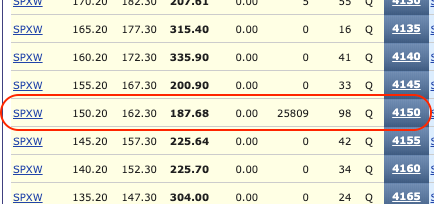
Such a short term ITM call has a delta of almost 1.
With roughly half the size, this fully offsets the strategy delta:
1 * 4307 * $100 * 25,809 = $11bn
This extra ITM call meant that the fund's trade was delta neutral and it helped alleviate the immediate market impact.
With roughly half the size, this fully offsets the strategy delta:
1 * 4307 * $100 * 25,809 = $11bn
This extra ITM call meant that the fund's trade was delta neutral and it helped alleviate the immediate market impact.
Dealers didn't have to instantly sell $SPX to delta hedge the strategy and were covered for a day.
Of course, when it expired yesterday, dealers had to find another delta hedge and eventually short the $SPX.
Of course, when it expired yesterday, dealers had to find another delta hedge and eventually short the $SPX.
Interestingly, the market closed -1.19% yesterday, and $SPX futures were a little under the weather this morning too.
With everything that's going on in the world right now, this could be a coincidence, but an extra 10bn supply of $SPX surely didn't help the bull case yesterday.
With everything that's going on in the world right now, this could be a coincidence, but an extra 10bn supply of $SPX surely didn't help the bull case yesterday.
Now, this 45,000 contracts trade is still sitting there for everyone to see.
What does it mean for investors going forward?
Well, that's the most interesting bit! 🙂
What does it mean for investors going forward?
Well, that's the most interesting bit! 🙂
For options dealers, this is a positive delta trade that has to be continuously delta hedged from now until it expires on New Year's Eve 🥳🎄
Given the size of the trade, these delta hedging flows can have a meaningful market impact.
Given the size of the trade, these delta hedging flows can have a meaningful market impact.
My trusted broker app currently tells me that the strategy delta has now moved to -0.60, as the BTD crowd pushed the $SPX higher today.
The same app shows that for +/-1% move in $SPX, the delta will move +/-0.03 points.
The same app shows that for +/-1% move in $SPX, the delta will move +/-0.03 points.
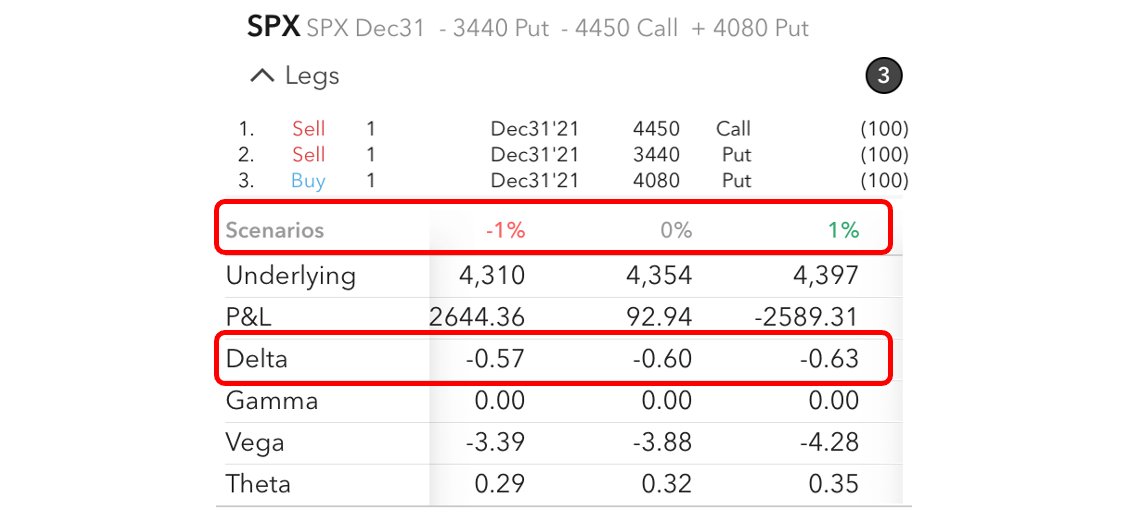
What does this mean in terms of dealer hedging flows?
For example, if $SPX rises +1%, the fund's delta on this trade will move from -0.60 to -0.63, and the dealers will need to sell that extra 0.03 of $SPX delta to remain delta neutral.
For example, if $SPX rises +1%, the fund's delta on this trade will move from -0.60 to -0.63, and the dealers will need to sell that extra 0.03 of $SPX delta to remain delta neutral.
In dollar terms, it means they need to sell:
0.03 * 4,340 (~current spot) * $100 * 45,000 = $585,900,000 of $SPX for a 1% move.
0.03 * 4,340 (~current spot) * $100 * 45,000 = $585,900,000 of $SPX for a 1% move.
Equally, they'll have to buy the same amount in case $SPX falls by 1%.
Of course, delta is not static and these hedging amounts will change as index moves around and time goes by.
This is an example of dealer positive Gamma - they sell when the index rises and buy when it falls
Of course, delta is not static and these hedging amounts will change as index moves around and time goes by.
This is an example of dealer positive Gamma - they sell when the index rises and buy when it falls
Hence, over the next three months, the 4,450 strike call can act as a magnet for the market 🧲
Unless, of course, more powerful forces push the index outside this call's Gamma sphere of influence.
Unless, of course, more powerful forces push the index outside this call's Gamma sphere of influence.
If that happens, put strikes of 3440/4080 might take over and have their own say regarding the market direction.
But that's a story for another thread! 🙂
But that's a story for another thread! 🙂
Thank you so much for taking the time to read this!
I sincerely hope you found it interesting and valuable.
Follow me (@perfiliev) for more educational threads around stocks, options and other topics within the incredible world of financial markets.
I sincerely hope you found it interesting and valuable.
Follow me (@perfiliev) for more educational threads around stocks, options and other topics within the incredible world of financial markets.
In case you enjoy watching videos, I'd like to invite you to my YouTube channel, where I also cover various financial topics:
youtube.com/c/PerfilievFin…
youtube.com/c/PerfilievFin…
For more information about the fund discussed in this thread, have a look at:
am.jpmorgan.com/us/en/asset-ma…
And make sure to follow Cem @jam_croissant for more updates on this trade 🙂👍
am.jpmorgan.com/us/en/asset-ma…
And make sure to follow Cem @jam_croissant for more updates on this trade 🙂👍
TL;DR:
1. JHEQX runs a systematic options hedging strategy every quarter.
2. As Q3 ended and Q4 started, the trade was rolled over.
3. Currently, there's around 45,000 open interest sitting at 31 Dec 2021 expiry.
4. Trade is short 3440 put, long 4080 put and short 4450 call.
1. JHEQX runs a systematic options hedging strategy every quarter.
2. As Q3 ended and Q4 started, the trade was rolled over.
3. Currently, there's around 45,000 open interest sitting at 31 Dec 2021 expiry.
4. Trade is short 3440 put, long 4080 put and short 4450 call.
5. Market makers have the opposite side and have to delta hedge.
6. Initial delta hedge is short around 10bn of SPX.
7. Currently, for +/- 1% move in $SPX, market makers will need to sell/buy approx. $500 mill of $SPX to stay delta neutral.
6. Initial delta hedge is short around 10bn of SPX.
7. Currently, for +/- 1% move in $SPX, market makers will need to sell/buy approx. $500 mill of $SPX to stay delta neutral.
• • •
Missing some Tweet in this thread? You can try to
force a refresh

