Scotland: 2021 mortality through week 39 (NRS)
1/ Overall
Week 39 not only in excess of 5 year average, but in keeping with recent weeks it is above the max range of the last 20 years.
Now 19 consecutive weeks of above average mortality in Scotland.
1/ Overall
Week 39 not only in excess of 5 year average, but in keeping with recent weeks it is above the max range of the last 20 years.
Now 19 consecutive weeks of above average mortality in Scotland.

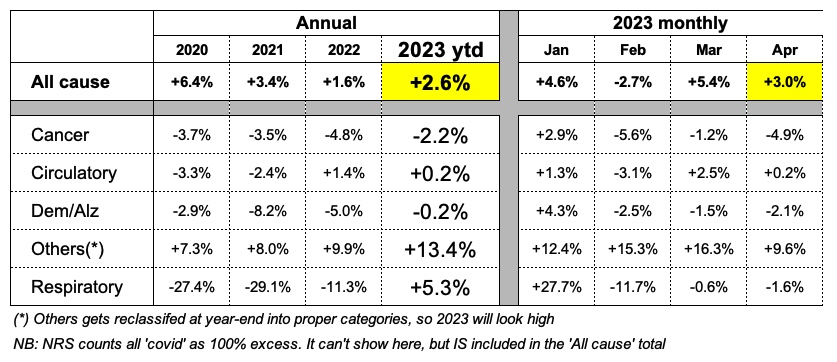
2/ Excess mortality by cause
Showing now as a little more than half of the excess is covid, although that proportion coming down. Mortality classed as covid is nearly 3x higher than summer 2020.
Showing now as a little more than half of the excess is covid, although that proportion coming down. Mortality classed as covid is nearly 3x higher than summer 2020.

3/ Excess mortality by location
Again this week some excess in hospital, but by far predominantly remains excess mortality at home. Through summer this has been about 1,800 deaths higher than normal.
Again this week some excess in hospital, but by far predominantly remains excess mortality at home. Through summer this has been about 1,800 deaths higher than normal.

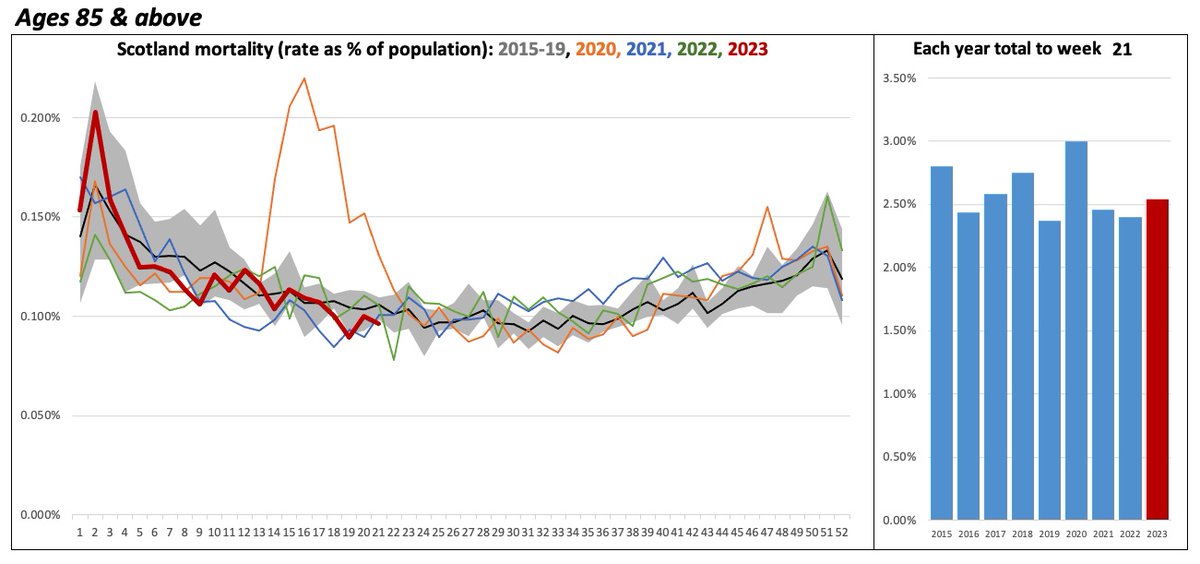
4/ Overall mortality by age, versus 5 year average
Growing excess in 85+ and 75-84 age groups. 65-74 up sharply in recent weeks, and even 45-64 separating from the 5 year trendline now.
Growing excess in 85+ and 75-84 age groups. 65-74 up sharply in recent weeks, and even 45-64 separating from the 5 year trendline now.

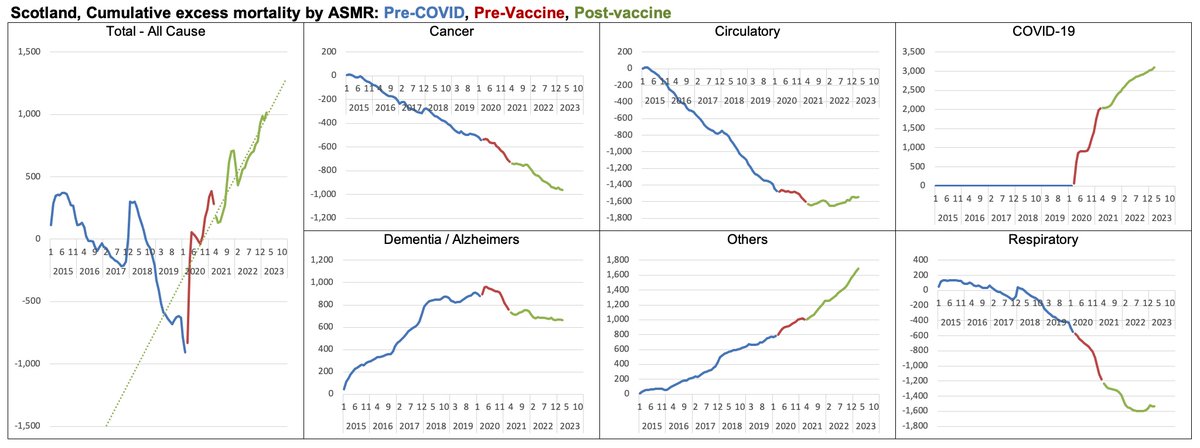
5/ Combined excess summer mortality
Combine those three for the summer period and we see excess mortality of +2,168
- Mainly ‘Other’, then equally cancer, circulatory, respiratory
- All occuring at home
- Stratifying by age, highest in the eldest age group
Combine those three for the summer period and we see excess mortality of +2,168
- Mainly ‘Other’, then equally cancer, circulatory, respiratory
- All occuring at home
- Stratifying by age, highest in the eldest age group

6/ Total mortality and vaccination by age
Changed to add 1-14 years age group.
Changed to add 1-14 years age group.

7/ Child mortality
Excess mortality showing both Q2 and Q3, but all coming from <1 age group. 1-14 age group remains below normal, as it has been throughout.
Excess mortality showing both Q2 and Q3, but all coming from <1 age group. 1-14 age group remains below normal, as it has been throughout.


8/ Summer excess
Summer 2020/2021 versus the 2015-19 average for the same period.
Now 2,193 (13%) above 5 year average, +2,122 from last summer. The highest deviation from 5 year average is 4%. 2021 was 3x that, and the trend is worsening.
Hope the 2 week easing trend continues
Summer 2020/2021 versus the 2015-19 average for the same period.
Now 2,193 (13%) above 5 year average, +2,122 from last summer. The highest deviation from 5 year average is 4%. 2021 was 3x that, and the trend is worsening.
Hope the 2 week easing trend continues

• • •
Missing some Tweet in this thread? You can try to
force a refresh