
🐭 We’re keeping the old normal. (for awareness, if ever ID is required to use this platform, this account will sleep)
 Ages 75-84 were most hit by flu, beyond even the high of 2018. Thus showing as a high year initially, then below average but since has been running the high end of normal range.
 First, by cause.
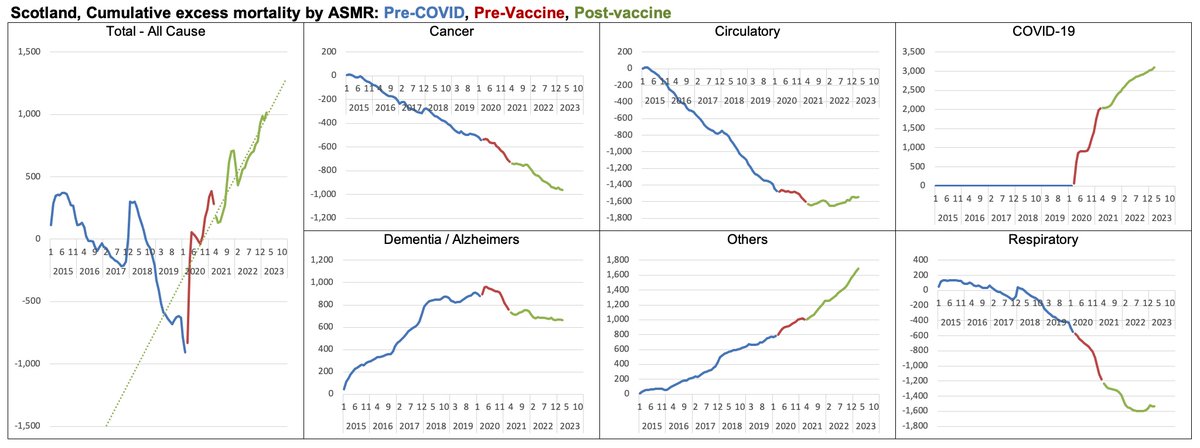
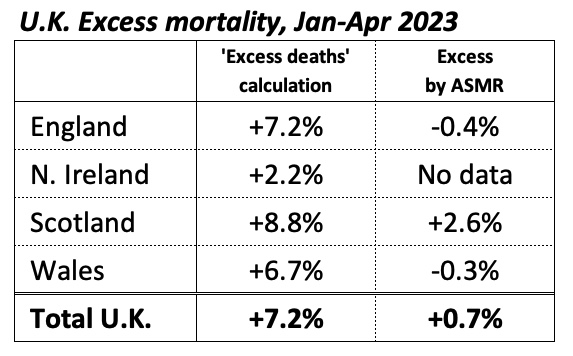 The chart shows monthly excess by ‘excess deaths’ and by ‘ASMR”. We see ‘excess deaths has ALWAYS measured higher than ASMR - this is not new.

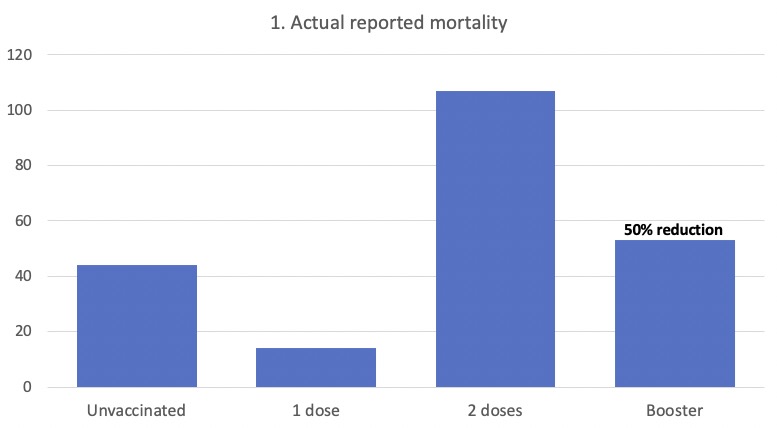
 "But still, robust protection against hospitalisation..."
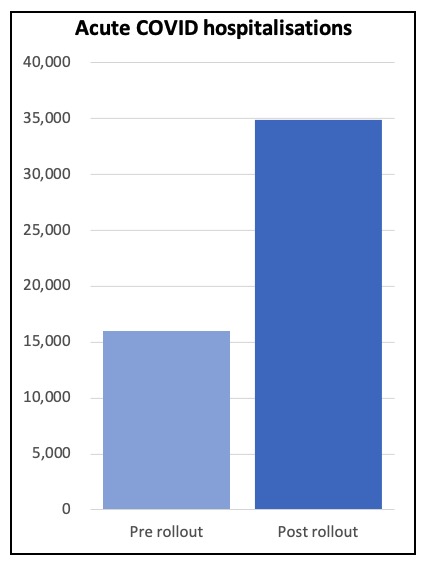
 What we see is;
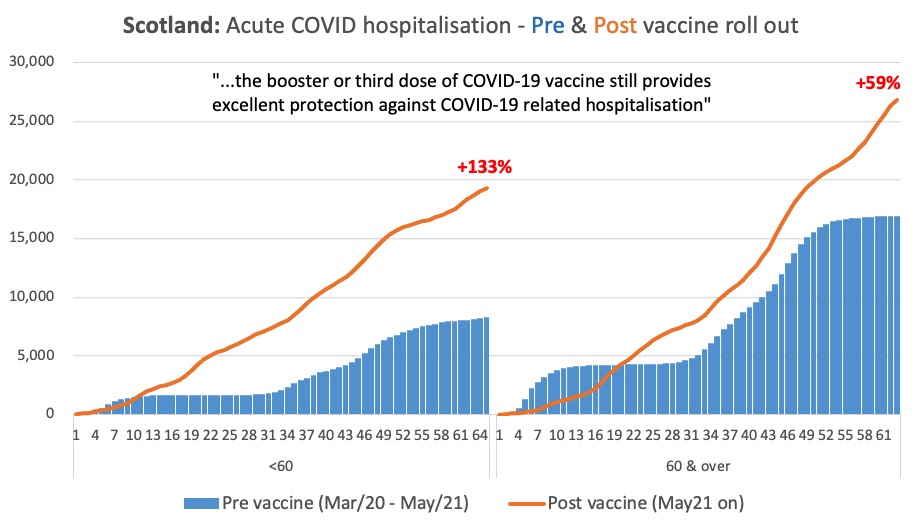
 2. You need an op - how is the waitlist?
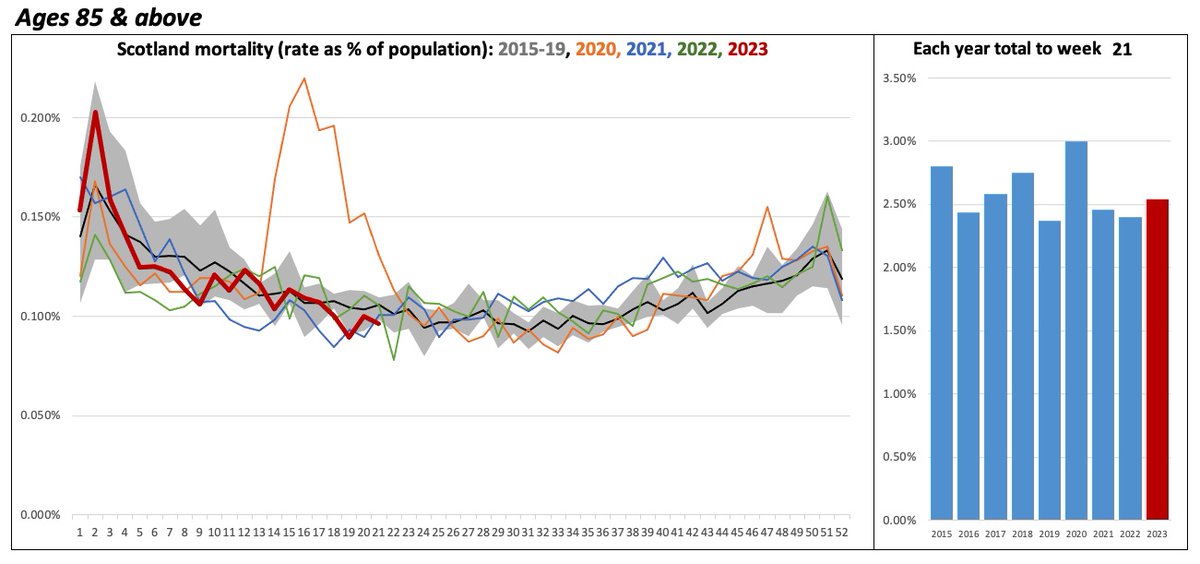
 That said, this has been / is the highest period of excess mortality Scotland has ever seen at this time of year, other than the lockdown induced mayhem of 2020.
 This overlays 2022 excess with the unprecedented summer 2021 spike. The trend is worse at this point, +1,066 deaths from 5 year average, and higher than at the same point in 2021.
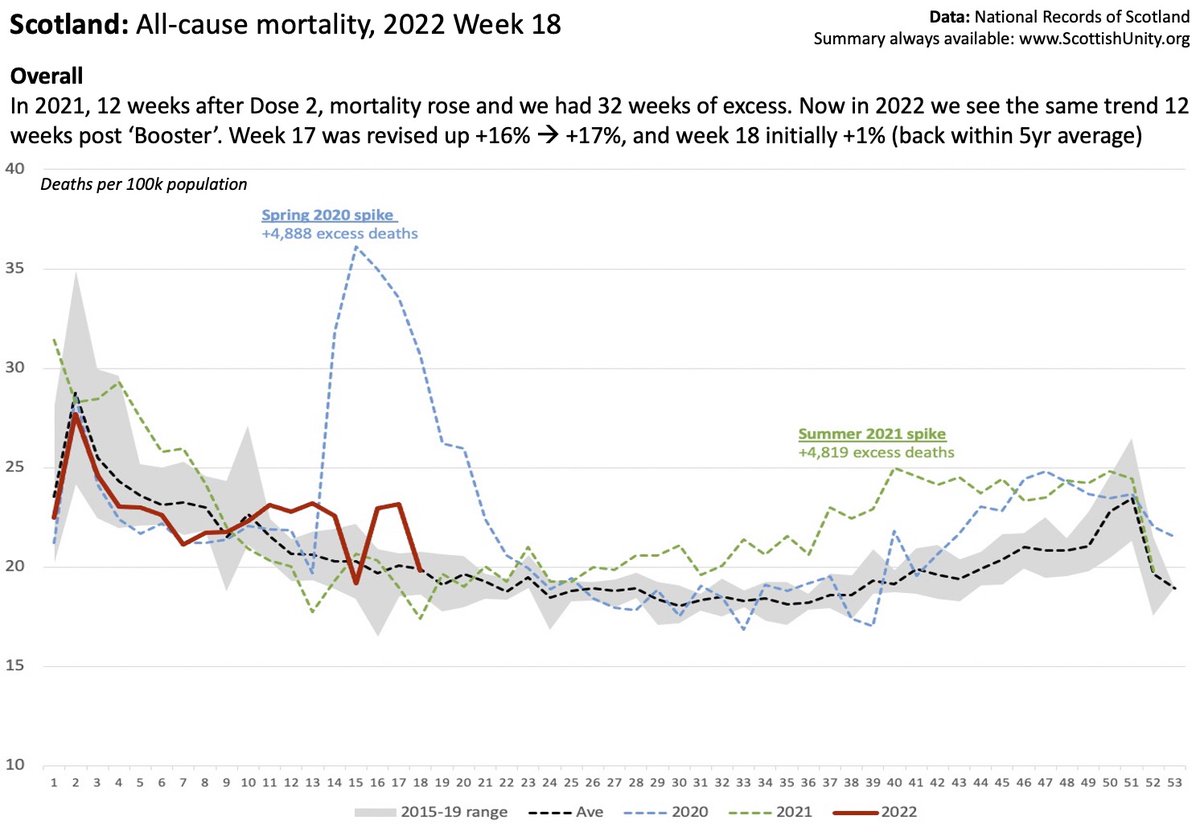 This shows the cumulative trend, this spike relative to last summer’s. You can see tracking very similar, but actually slightly more severe over the same period of time.
 Then if we see the mortality trend of age 1-14 (excluding <1 y.o.), females look rather low, and males are high end of normal, behind 2015 and 2016
 Age group 45 to 64
 This shows the weekly percentage excess. Summer 2021 stands out - 32 weeks of excess - and the small insert chart shows the current trend overlaid on that.
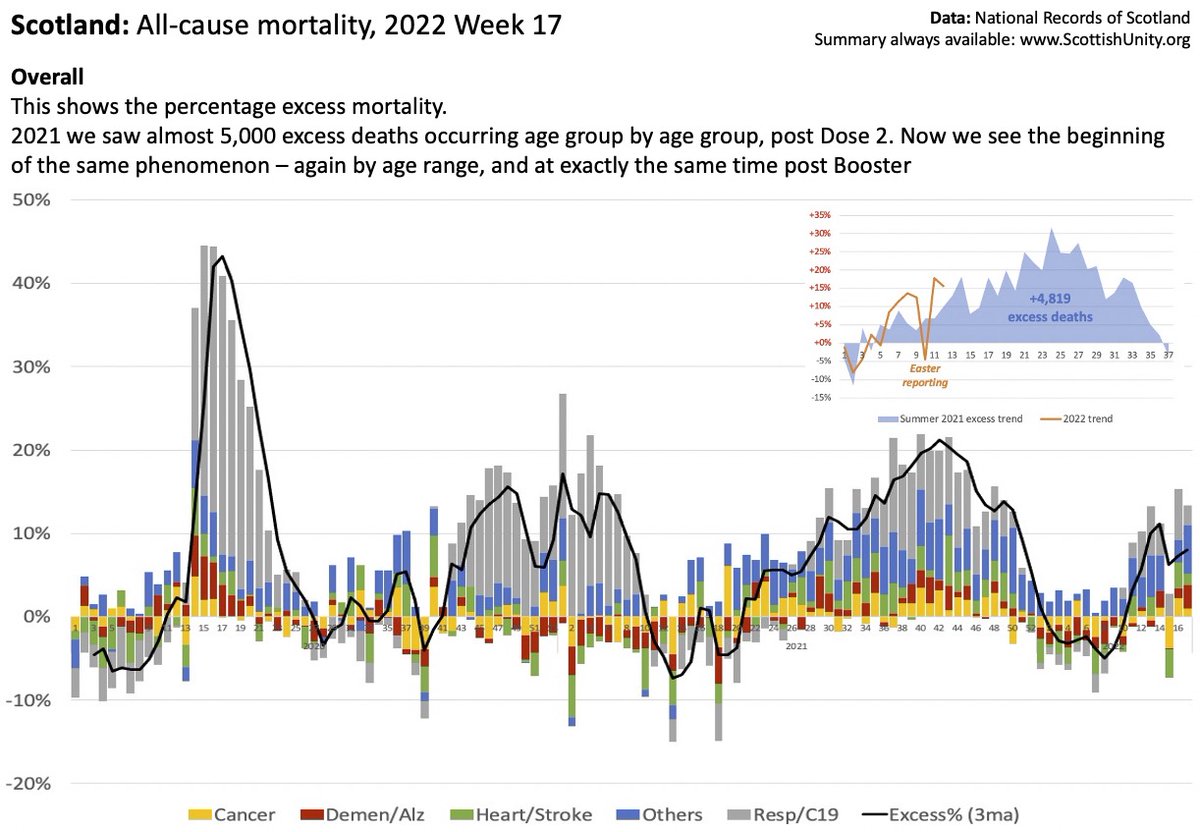
 Excess mortality by cause of death and by location of death.
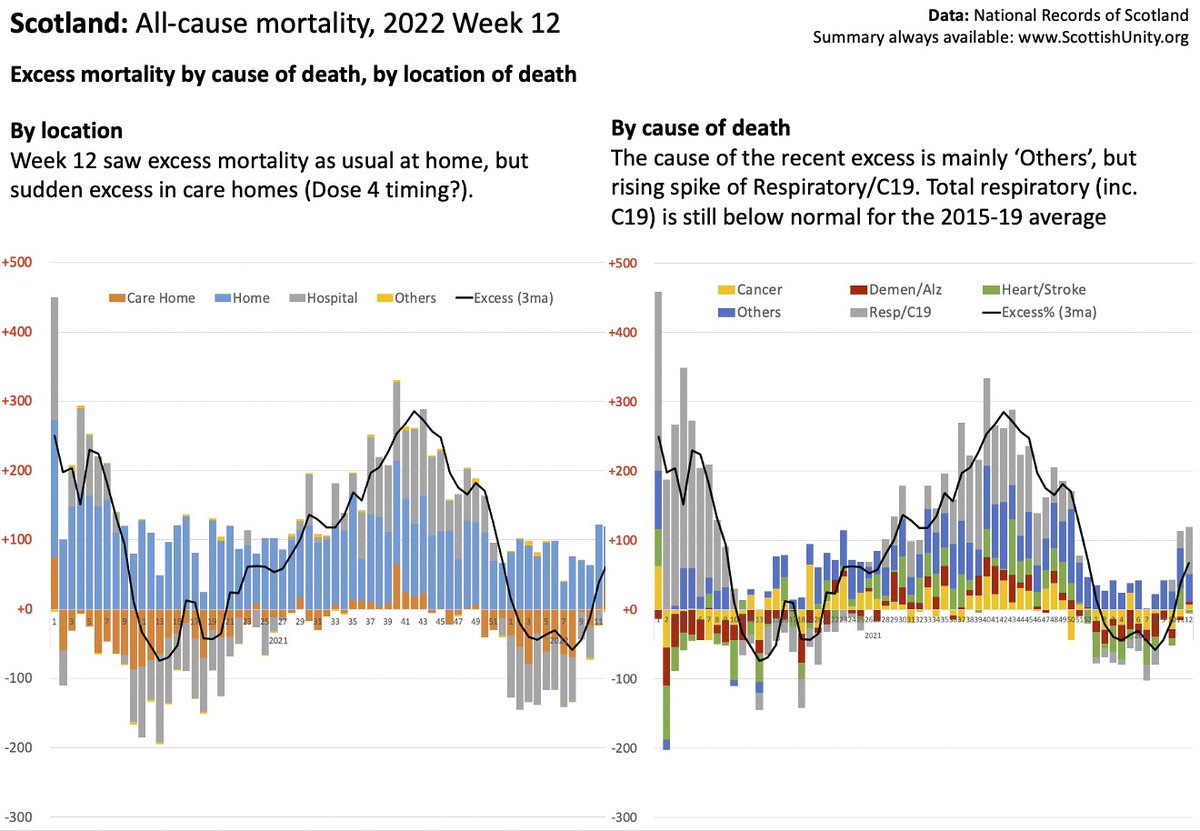
 The step up in Week 11 was excess deaths at home, and the causes were ‘Others’, and Circulatory (heart attack, stroke), with some Respiratory

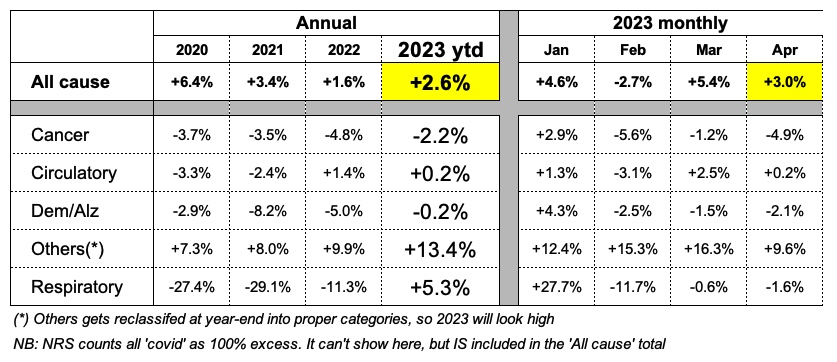
 By cause: ‘Others’ elevated, and main causes all below normal. Somehow we have ‘covid deaths’ but overall Respiratory has been normal since Christmas. Misattribution?
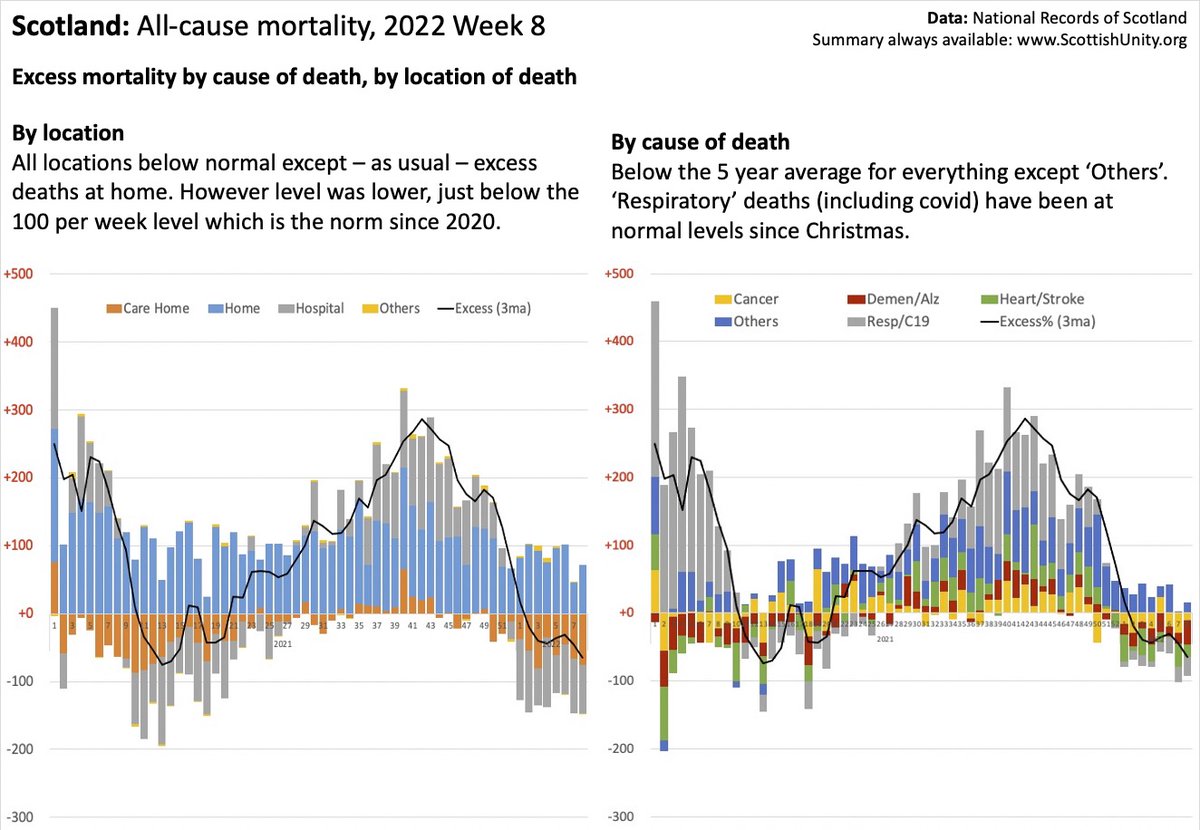
 2/ Risk by population
 Total mortality by cause.
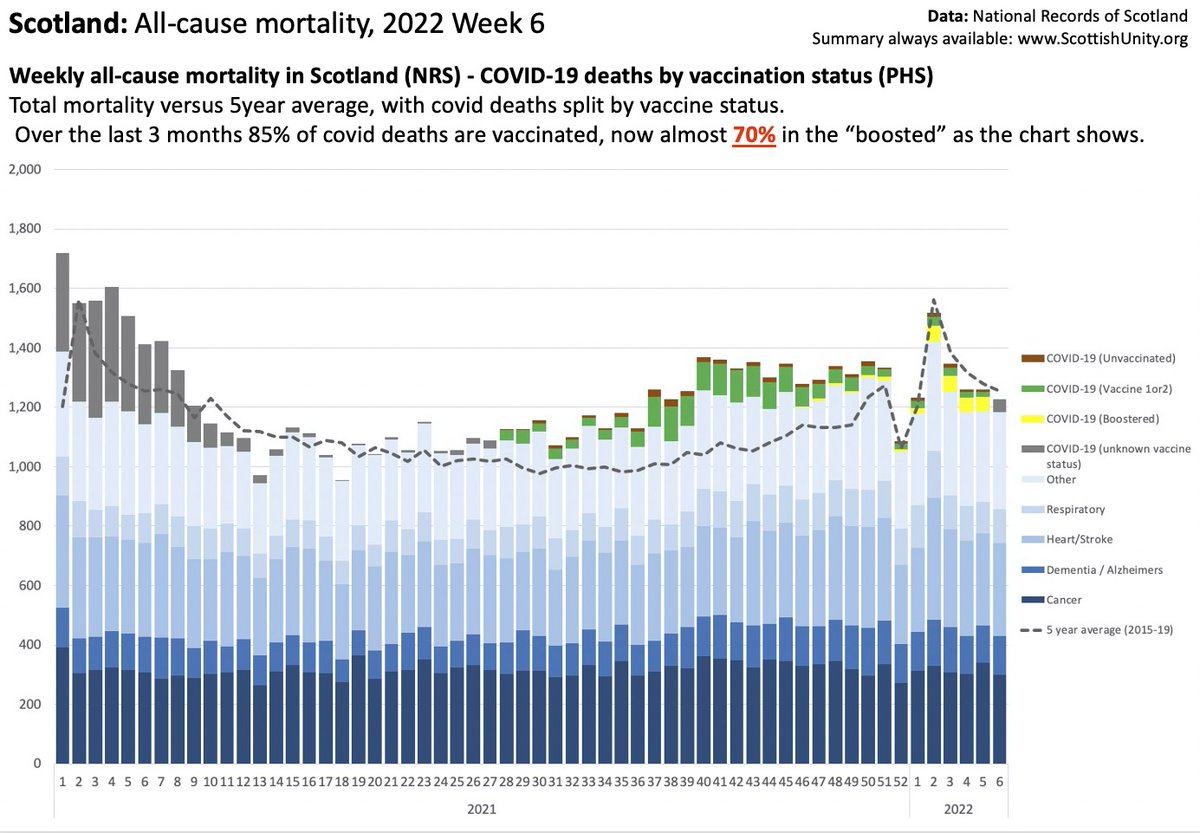
 “But we have to look at population"
 Same data but shown by cause, with ‘covid mortality’ split by vaccination status. 83% of ‘deaths with covid’ vaccinated, and more majority now becoming ‘boosted'
 2/ The raw data fails to account for the population numbers of each - so we can divide deaths by population, to get a mortality rise for each cohort.