I'm curious about the most tweeted about #rstats packages in the past ~week, let's explore this using R! 🧵

I'm going to use these packages:
*️⃣ tidyverse
*️⃣ rtweet
*️⃣ rvest
*️⃣ tidytext

you can install them with:
install.packages(c("tidyverse", "rtweet", "rvest", "tidytext"))
First, let's get a vector of all #rstats packages on CRAN!

library(rvest)

r_pkgs <- read_html('cloud.r-project.org/web/packages/a…') %>%
  html_nodes('td:nth-child(1)') %>%
  html_text() library(rvest)  r_pkgs <- read_html('https://cloud.r-project
Then let's pull in all tweets in the past week or so that use the #rstats hashtag

library(rtweet)

df <- search_tweets(q = "#rstats", n = 7000, include_rts = FALSE) library(rtweet)  df <- search_tweets(q = "#rstats"
Alright! If you're following along live, we've got 4,948 tweets (you may get a different number if you run this in a few minutes! In fact, I expect you'd at least pick up one more tweet: this one! #rstats)
🧹 Let's tidy this up! I'm going to build up step-by-step here.

First let's unnest the text into words.

library(tidyverse)
library(tidytext)

pkgs <- df %>%
unnest_tokens(word, text) library(tidyverse) library(tidytext)   pkgs <- df %>%   unne
Now let's remove any "stop words" this will be things like "not", "do" etc.

library(tidyverse)
library(tidytext)

pkgs <- df %>%
unnest_tokens(word, text) %>%
anti_join(stop_words) library(tidyverse) library(tidytext)   pkgs <- df %>%   unne
Now I'm going to keep only the "words" that are found in that character vector of packages we created before (I called it r_pkgs)

library(tidyverse)
library(tidytext)

pkgs <- df %>%
unnest_tokens(word, text) %>%
anti_join(stop_words) %>%
filter(word %in% r_pkgs) library(tidyverse) library(tidytext)   pkgs <- df %>%   unne
Let's count up the words and keep the top 5 to plot.

library(tidyverse)
library(tidytext)

pkgs <- df %>%
unnest_tokens(word, text) %>%
anti_join(stop_words) %>%
filter(word %in% r_pkgs) %>%
count(word) %>%
slice_max(n, n = 5) library(tidyverse) library(tidytext)   pkgs <- df %>%   unne
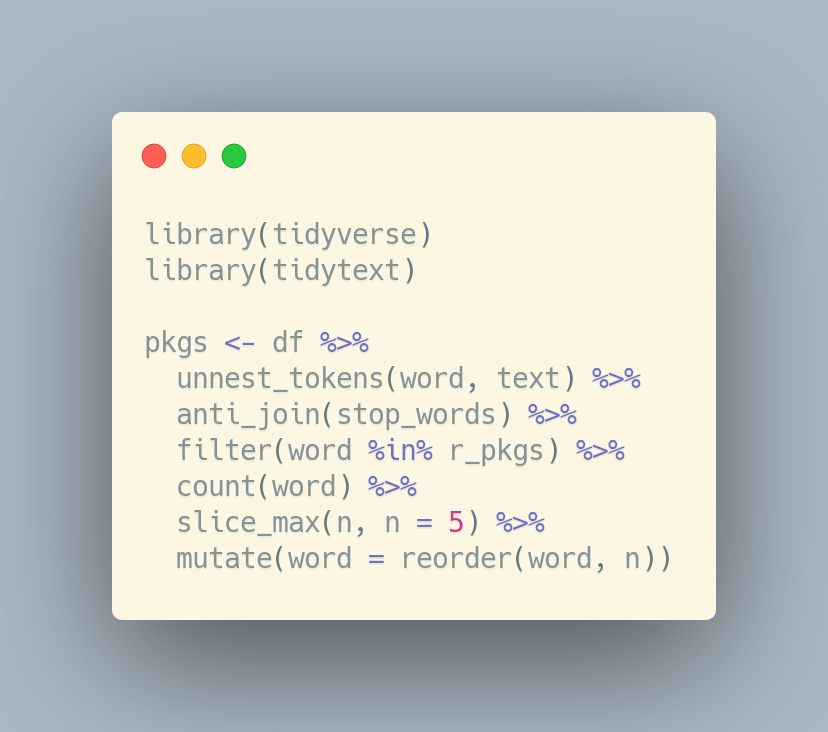
Ok, final tidying step, let's reorder so it plots nicely

library(tidyverse)
library(tidytext)

pkgs <- df %>%
unnest_tokens(word, text) %>%
anti_join(stop_words) %>%
filter(word %in% r_pkgs) %>%
count(word) %>%
slice_max(n, n = 5) %>%
mutate(word = reorder(word, n))
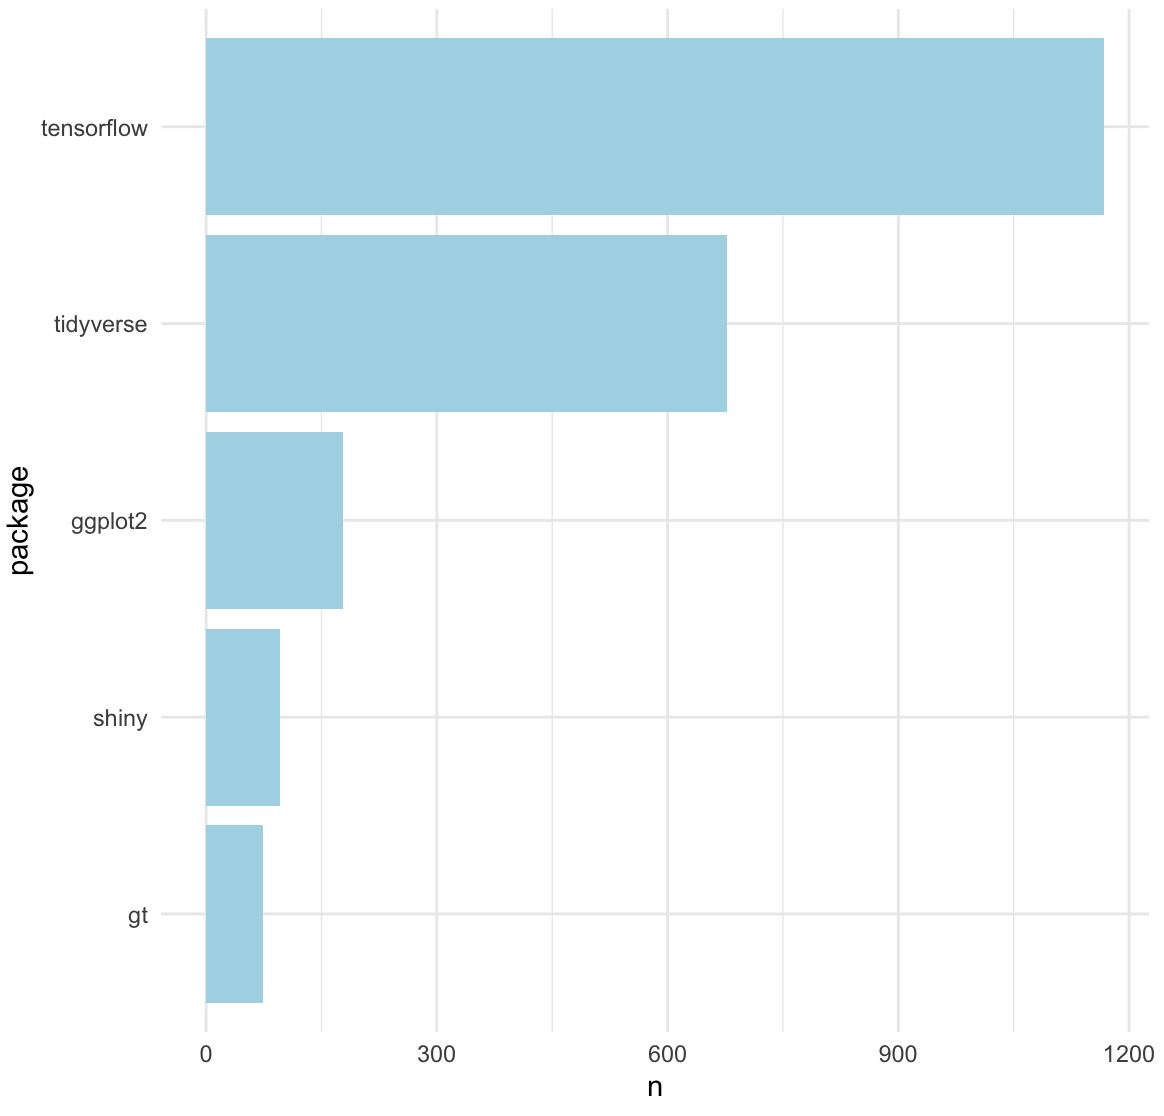
 library(tidyverse) library(tidytext)   pkgs <- df %>%   unne
Let's plot it!

ggplot(pkgs, aes(n, word)) +
geom_col(fill = "light blue") +
labs(y = "package") ggplot(pkgs, aes(n, word)) +    geom_col(fill = "light
And there we have it! Top 5 recently tweeted about #rstats packages:

🥇 tensorflow
🥈 tidyverse
🥉 ggplot2
🏅 shiny
🏅 gt

Thanks for following along!

• • •

Missing some Tweet in this thread? You can try to force a refresh
 

Keep Current with Women in Statistics and Data Science

Women in Statistics and Data Science Profile picture

Stay in touch and get notified when new unrolls are available from this author!

Read all threads

This Thread may be Removed Anytime!

PDF

Twitter may remove this content at anytime! Save it as PDF for later use!

Try unrolling a thread yourself!

how to unroll video
  1. Follow @ThreadReaderApp to mention us!

  2. From a Twitter thread mention us with a keyword "unroll"
@threadreaderapp unroll

Practice here first or read more on our help page!

More from @WomenInStat

12 Oct
👋 @LucyStats here! It's been a very exciting week for folks in Causal Inference with the Nobel Prize announcements, I thought it'd be neat to dive back in history to hear about a previous Nobel winner, Ronald Ross

1/
This topic is fun because it spans a whole myriad of my interests!
✔️We've got stats!
✔️We've got poetry!
✔️We've got infectious disease epidemiology!

Much of what I'll chat about today I learned from this article: pubmed.ncbi.nlm.nih.gov/12762435/

2/
Ronald Ross won the Nobel Prize for Physiology or Medicine in 1902 "for his work on malaria, by which he has shown how it enters the organism and thereby has laid the foundation for successful research on this disease and methods of combating it."

nobelprize.org/prizes/medicin…
3/
Read 12 tweets
30 Sep
Today, I would like to share some resources on causal inference. - a thread ⬇️
I came to this topic, while working with clinicians who use IPW and matching on a daily basis (they are not familiar with double robust approaches). I don’t know for you, but I am so admirative of them as they combine their work with patients with research to advance knowledge
I recommend @Susan_Athey's videos (such as aeaweb.org/webcasts/2018/…), an example of pedagogy - they also make available the analysis notebooks, gsbdbi.github.io/ml_tutorial/in…. For a longer and more technical course see, Stefan’s Wager web.stanford.edu/~swager/stats3…
Read 6 tweets
29 Sep
Now, I would like to mention an R package, FactoMineR that I use on a daily basis to explore and visualize heterogeneous data: quantitative, categorical, with group structures, (multiple) contingency tables.

At its core, SVD! (I am also an SVD fan, @daniela_witten ;-).
@daniela_witten FactoMineR is indebted to the “French School of Data Analysis” (see arxiv.org/abs/0805.2879 or juliejosse.com/data-analysis/ for historical background), a field of statistics I was trained in.
@daniela_witten Note it was also the case for the famous @SherlockpHolmes, a role model for reproducibility, who I admire both from a scientific and personal point of view.
Read 5 tweets
29 Sep
Hello!
So today, I will share a few thoughts and advice I usually give to my PhD students. I hope this might be helpful for a wider audience, even if it is obvious and already stated by others. Anyway, as a teacher, we know repetition is important ;) - a thread ⬇️
1)Ask questions
Ask questions
Ask questions
….
Ask questions!
I mean that: don't hesitate to ask questions in seminars (in France in particular, we don't dare enough). Be curious, don’t be shy.
2) If you are tired and can't work, just don’t. Take a break, take a walk if you can. I've never regretted it, although I've often regretted staying in front my computer all day because I couldn't get anything done
Read 12 tweets
28 Sep
Missing Data, a thread ⬇️
Missing values are everywhere! We have listed more than 150 R packages in cran.r-project.org/web/views/Miss…
So let us give few pointers:
The method of handling missing data depends on the purpose of the analysis: estimation, completion, prediction, etc.
1) For inference with missing values, estimating as well as possible a parameter and giving a confidence interval, consider likelihood approaches (using EM algorithms) or multiple imputation
2) Single Imputation/Matrix completion aims at completing (predicting the missing entries) a dataset as best as possible. Multiple imputation aims at estimating parameters and their variability, taking into account the uncertainty due to missing values
Read 18 tweets
27 Sep
I have been working for >10 years on missing data.
My passion for data science mainly comes from its transversality: as a statistician, we can interact with so many scientific fields!
With missing data the same is true but within statistics, as it can pop up in all its branches.
When I first meet a scientist for a new project, I always start the conversation by asking “Show me the data!” to understand the underlying challenges.
So far, I have never been shown a complete dataset... (of course there might be some bias!).
With @imkemay, Aude Sportisse, @nj_tierney and @Natty_V2, we created the Rmistatic platform rmisstastic.netlify.app, to organize all the resources (courses, tutorials, articles, software, etc.) and implement analysis pipelines with missing data in R/Python.
Read 4 tweets

Did Thread Reader help you today?

Support us! We are indie developers!


This site is made by just two indie developers on a laptop doing marketing, support and development! Read more about the story.

Become a Premium Member ($3/month or $30/year) and get exclusive features!

Become Premium

Too expensive? Make a small donation by buying us coffee ($5) or help with server cost ($10)

Donate via Paypal Become our Patreon

Thank you for your support!

Follow Us on Twitter!

:(