1/ Near-real-time monitoring of global CO2 emissions reveals the effects of the COVID-19 pandemic (Liu et al.)
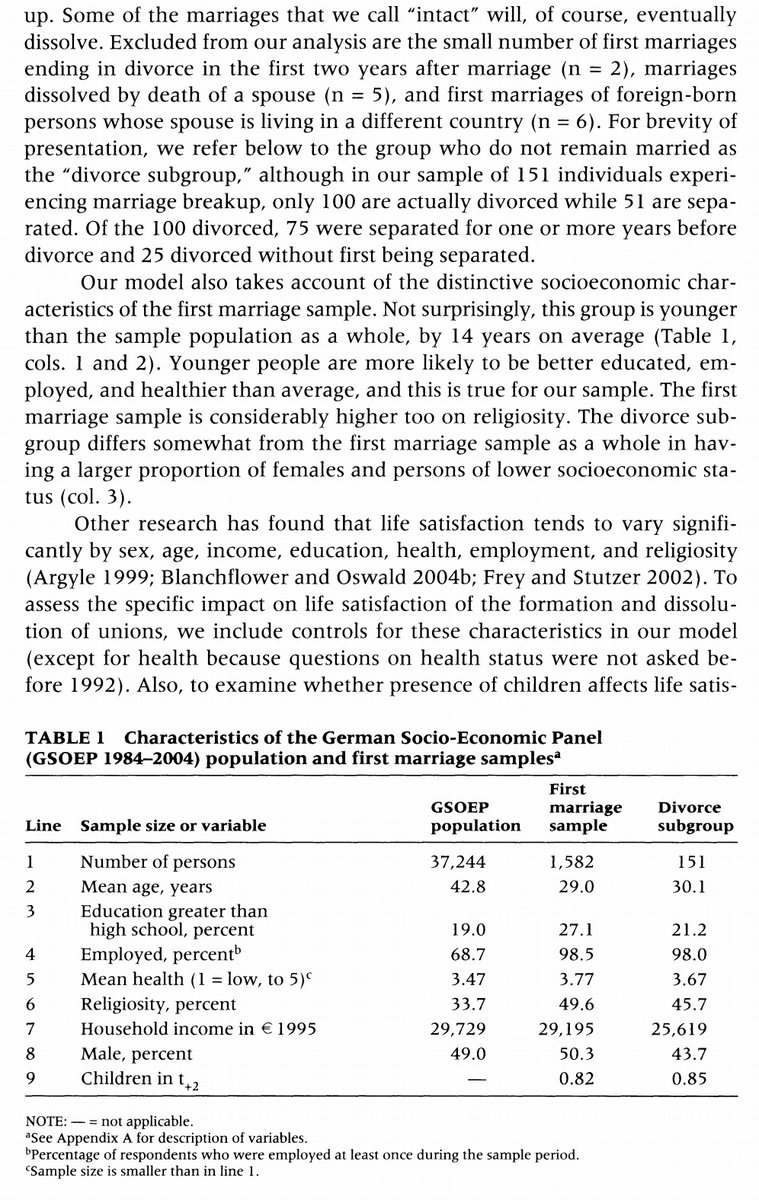
"Global CO₂ emissions decreased by 8.8% in the first half of 2020 vs. the same period in 2019. The timing corresponds to lockdown measures."
nature.com/articles/s4146…
"Global CO₂ emissions decreased by 8.8% in the first half of 2020 vs. the same period in 2019. The timing corresponds to lockdown measures."
nature.com/articles/s4146…

2/ "In winter (Jan–Mar) of 2020, COVID-19 explains 85% of the power sector reduction, the rest being attributed to exceptionally warm weather across much of the northern hemisphere.
"The total difference is the largest ever decline in emissions over the first half year."
"The total difference is the largest ever decline in emissions over the first half year."


3/ "The rebound is normal, especially in energy-intensive industries, in which industrial activities and infrastructure construction was suspended during lockdown. This could result in the shortage of industrial products and rebound of production after the lockdown is released."

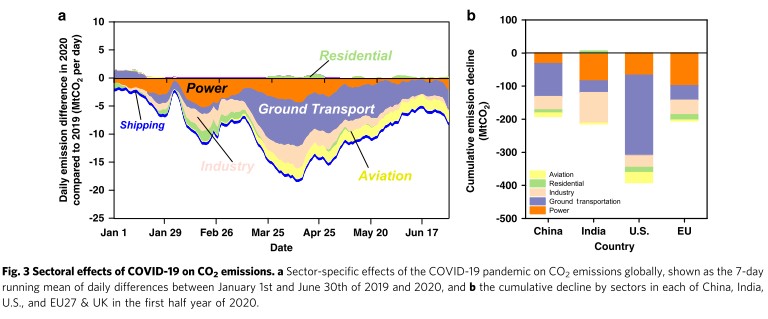
4/ "The largest contributions to the global decrease in emissions in 2020 come from ground transportation and the power sector, with somewhat smaller decreases from the industry sector and the aviation sector. Further details of these sectoral changes are discussed below."
5/ "Some of the drop in China’s power sector emissions was due to warmer winter temperatures in 2020. The negligible differences in emissions during late January and early February of 2020 and 2019 are explained by the different dates of China’s Spring Festival."


6/ "Global heating demand in the first seven months of 2020 was down by -2.1% vs. 2019, owing to the abnormally warm northern-hemisphere winter condition. This estimate rests on the assumption that residential and commercial fuel consumption was driven mostly by temperature."

7/ "Our estimates of decreases in fossil and industry CO2 emissions are consistent with observed changes in NO₂ emissions, which are also mainly produced by fossil fuel combustion."

8/ "The absolute decreases in CO2 emissions are larger than any in history, including during the 2008–09 global crisis. An 8.8% relative reduction of emissions seems small when compared to the magnitude and extent of the disturbance of human activities that the COVID produced."
9/ "Long-term emissions decreases needed to achieve low targets must therefore be based on structural and transformational changes in energy production, de-carbonization of transportation, and improved building energy use efficiency rather than decreases of human activities."
10/ Related reading:
Unsettled
Polarizing impact of science literacy and numeracy on perceived climate change risks
Unsettled
https://twitter.com/ReformedTrader/status/1429917709051957257
Polarizing impact of science literacy and numeracy on perceived climate change risks
https://twitter.com/ReformedTrader/status/1411033851288117248
• • •
Missing some Tweet in this thread? You can try to
force a refresh