I believe the top of Bitcoin is the most likely to occur around $72,000-$75,000, leading into a multi-year bear market.
In this thread, I will present my case as to why I believe this.
In this thread, I will present my case as to why I believe this.
I want to preface this by saying I've been a bull on Bitcoin for the entirety of my YouTube channel, established in 2019, with 550+ videos published. I was also bullish on Bitcoin during this most recent pullback of Bitcoin in May, June, and July, expecting new All Time Highs.
So, I'm not a mega bear, who is wrong footed in a short position. This is a data driven thread. Take from it what you will. But, it's my best guess and speculation as to where the top of Bitcoin is.
Let's begin.
Let's begin.
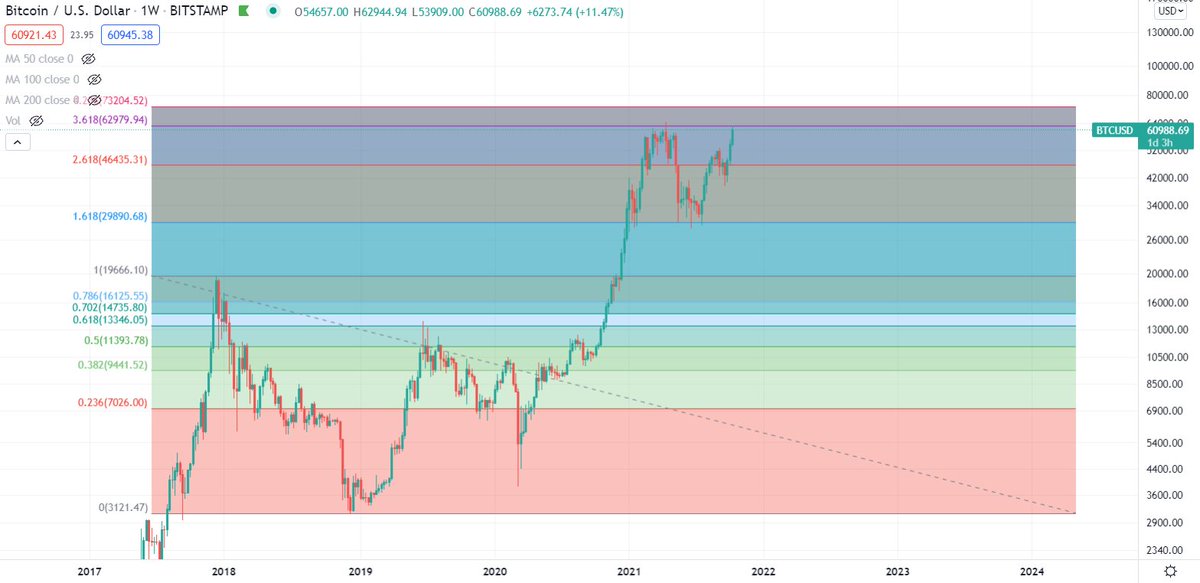
Fibonacci Extensions are amazing. They accurately predict tops frequently. Whether it is the balance of the universe, or trading bots behaving at these levels, they tend to be reactionary levels. We see this all the time. Currently, the 4.236 Fib sits at $74,222 on Coinbase. 

This varies based on exchanges, the 4.236 extension is at the following locations based on their exchanges:
Bitstamp = $73,204
Bitfinex = $73,859
Bittrex = $73,972
And if we look at CoinMarketCap, we get $74,711 as the 4.236 extension.
Bitstamp = $73,204
Bitfinex = $73,859
Bittrex = $73,972
And if we look at CoinMarketCap, we get $74,711 as the 4.236 extension.
Based on the exchanges and CoinMarketCap, we have an approximate range of $73,000-$75,000 as the 4.236 Fibonacci Extension.
So, why does this matter?
We often seen this be the reaction level. Here is Ethereum in 2017:
So, why does this matter?
We often seen this be the reaction level. Here is Ethereum in 2017:

Here is NEO in 2017:

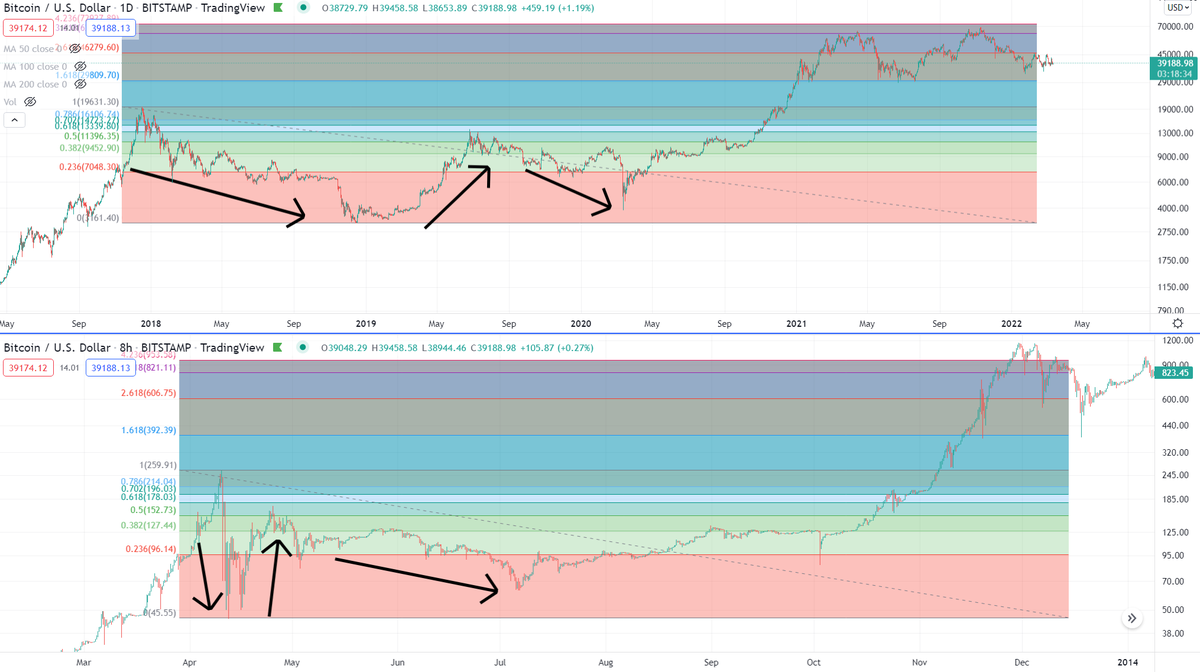
And notice how Bitcoin has the same structure as these setups had. The initial crash, a retrace back, then a trip back to the lows, then a breakout:
Okay, is that good enough to say with any real conviction that it seems likely the top is there? Maybe. But, I wouldn't make this thread if that's all I had to say. So, let's keep going.
Many revert back to the previous Bitcoin cycle, hoping we are going to $200,000+.
Many revert back to the previous Bitcoin cycle, hoping we are going to $200,000+.

And, there is a lot of hope that the current phase of Bitcoin is more so like this phase in 2013, with a big grand finale on the horizon:

However, of the last two years I have presented the idea that we are actually here:

You can especially see this when looking at the correction, or, "bear market" of 2018-2020, and how it behaved in relation to 2013:

If this was true, and we are replicating the distance of a previous "super cycle" of Bitcoin, that would take you to approximately $81,000.

The problem with this, is that structure doesn't show a 50% crash, like we just experienced with Bitcoin, where we fell to $29,000.... or does it?
Yes, it does:
Yes, it does:

Even in the 2013 run up, there was a 50% crash that took place prior to the final push to the end of the bull market.
I anticipated this, and sold 65% of my Bitcoin between $45,000-$58,000 back in February, to rotate it to the altcoin market.
I anticipated this, and sold 65% of my Bitcoin between $45,000-$58,000 back in February, to rotate it to the altcoin market.
https://twitter.com/BCBacker/status/1363565774804189186?s=20
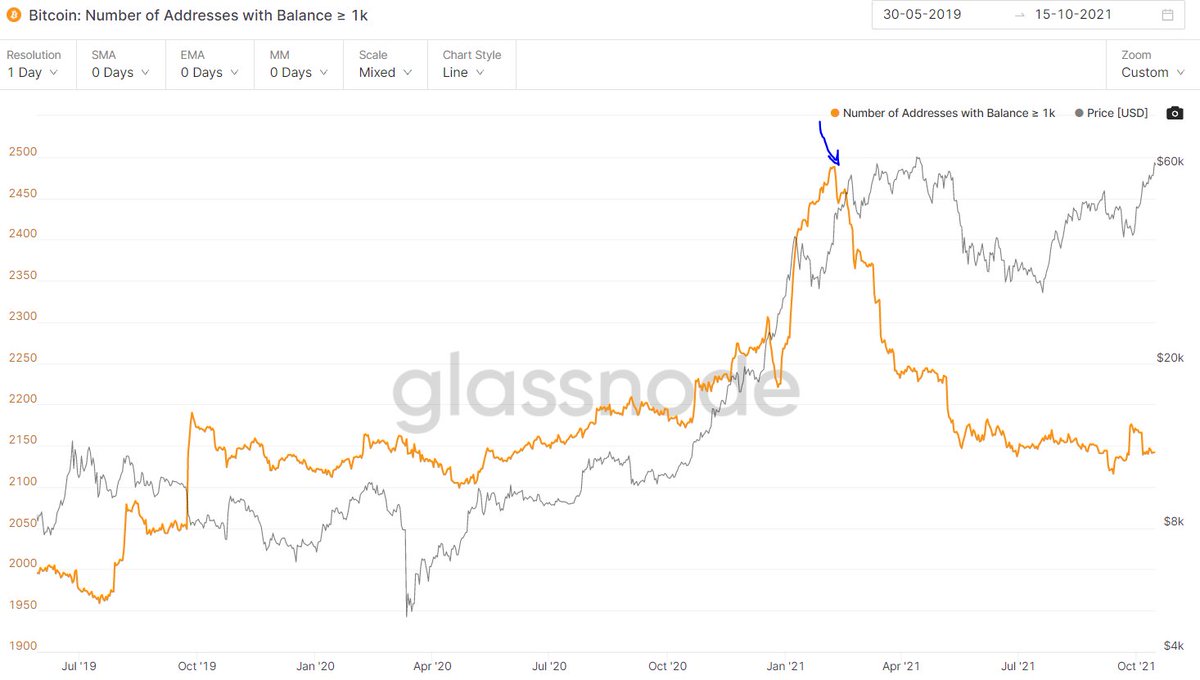
Turns out, the whales and large pockets all had the same idea, as it was time for the first major profit taking while retail was getting marketed by all the financial media to FOMO into Bitcoin.
The on-chain data shows all the large pockets dumping their Bitcoin starting at $45k
The on-chain data shows all the large pockets dumping their Bitcoin starting at $45k
I don't say that to brag that I did that there. Obviously, prices are higher than where I sold my Bitcoin. I say that to show that I've held this belief for a long time, and executed a plan based on it. Expecting a 50% crash, similar to 2013. And, well, in 2021, we got it in May.
So, the argument that we are following 2013 here, seems pretty valid up until this point:

Now, is it really valid to take the 2013 cycle and say we are doing that in 2021? How can I possibly say that this is correct, and none of the others are correct taking us to $200,000+?

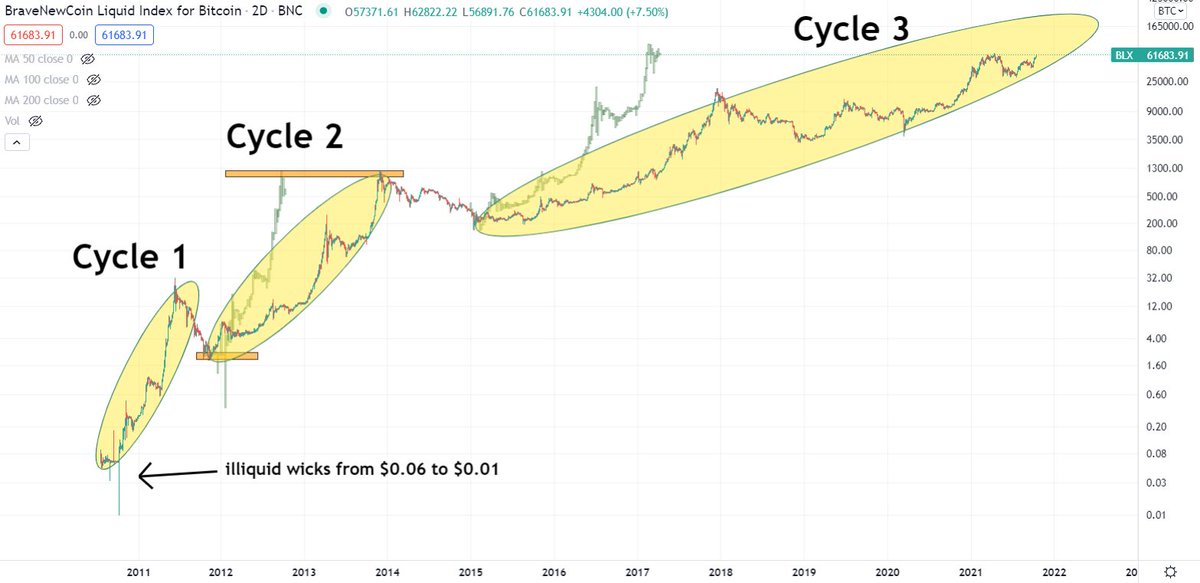
This is the BraveNewCoin Liquid Index (Ticker: BLX).
It tracks the Bitcoin price back to 2010, when Bitcoin was $0.05.
Something very interesting about the 2013 bull run was that it was of exact size of the 2011 bull run on log scale.
It tracks the Bitcoin price back to 2010, when Bitcoin was $0.05.
Something very interesting about the 2013 bull run was that it was of exact size of the 2011 bull run on log scale.

So, on log scale, the 2013 bull run was exactly the same size as the 2011 bull run. And, our current setup in Bitcoin is reaching the exact same extension of the Bitcoin bull runs in 2011, and 2013.
So what does this mean? Essentially, I'm arguing it isn't a 4-year cycle.
So what does this mean? Essentially, I'm arguing it isn't a 4-year cycle.
And that we are still in a continuation of the cycle that started back in 2015, and our bear market of 2018-2020 was just a "pit stop" along the way for the continuation of the current super cycle.
Based on what I've covered, if we are finishing up a super cycle, that puts us somewhere around $81,000 as the top of Bitcoin.
If we are following a 4.236 extension ending, that puts us somewhere around $73,000 to $75,000.
Let's look for measured moves on smaller timeframes.
If we are following a 4.236 extension ending, that puts us somewhere around $73,000 to $75,000.
Let's look for measured moves on smaller timeframes.
If we look at what has happened over the last several months with Bitcoin, an inverse head and shoulders has appeared to form, with a recent breakout.
To measure this, *if* it is an inverse head and shoulders, is the length of the head to the neckline, which takes us to $75,625.
To measure this, *if* it is an inverse head and shoulders, is the length of the head to the neckline, which takes us to $75,625.

So, we get the following numbers:
4.236 Fibonacci Extension: $73,000-$75,000
Bitcoin Super Cycle: $81,000
Inverse Head and Shoulders: $75,625
Something to note: In 2013 and 2017, when Bitcoin topped, it lead to Altcoin Mania.
4.236 Fibonacci Extension: $73,000-$75,000
Bitcoin Super Cycle: $81,000
Inverse Head and Shoulders: $75,625
Something to note: In 2013 and 2017, when Bitcoin topped, it lead to Altcoin Mania.
• • •
Missing some Tweet in this thread? You can try to
force a refresh