https://t.co/r5bZLaFwVL | YouTube | Chart Educating | XRP Enthusiast | 10 Years Sober | God Saves | You Can Accomplish Anything You Set Your Mind To | Not Financial Advice
6 subscribers
May 20, 2023 • 30 tweets • 8 min read
Does Bitcoin operate on magical 4-year cycles that have to do with the Bitcoin Block Reward Halving?
Get ready to have your world flipped upside-down if you believe it does.
Because I'm about to build my case that it's an urban myth.
1/x
The argument that 4-Year Block Reward Halving's are the cause of bull runs is due to reduced inflationary pressures on Bitcoin's price.
The less Bitcoin that is rewarded to miners, the less sell pressure they have.
Conceptually it makes sense.
But the charts have conflict.
Mar 18, 2023 • 5 tweets • 2 min read
Tinfoil hat time...
On September 17, 2019, the Fed quietly interjected in the overnight lending for banks with Repo bailouts.
The distraction, 8-days later on September 24th was Pelosi announces formal impeachment inquiry of Trump.
From a technical perspective, a lot of complications have come up once the FTX collapse happened.
In this thread I'll show the complexities happening in the crypto market compared to 2014 and to 2018.
This is no longer a "few" things, but has become a laundry list.
🧵
Before we start, let's just accept it was not "magic" for why Bitcoin topped in 2021. It was simple. It was a full 4.236 Fibonacci extension for the market cap. It didn't need a thousand indicators of magic to solve.
Sep 26, 2022 • 25 tweets • 8 min read
1) I believe the Dow Jones Industrial Average has popped.
That the LONG bear market, or "Great Depression" for the DJI has begun.
Many have built careers over the last decade proclaiming the Great Depression was upon us, only for the DJI to rip up 400%+ while they cried wolf. 2) I'm going to build a case as to why the 30+ year bear market for the DJI has begun, using charts.
I'll leave it to the experts to decipher trade calls, central bank planning, currency debasement, geopolitical wars, commodity shortages, etc.
But here, I'm just using charts.
Apr 27, 2022 • 8 tweets • 2 min read
I rarely talk about social pop culture events on here. But, Elon buying Twitter at $54.20 a share has to do with stocks, and I have a weird take on it.
I see the potential of this deal falling through, and there may be a trick up Elon’s sleeve where he still wins.
Three weeks ago, Elon bought 9% of Twitter.
I've often pointed to the XRP price charts accumulation structure that's been going on since April.
For fun, I've added this chart below. Before you move on in this thread, take a closer look at the chart, and try to guess what asset it is and when it happened?
Did you get it right?
It's Bitcoin from 2013.
An 82% crash in 48-hours. A crash, retrace, re-accumulation structure that went on to reach above a 4.236 extension later in the year.
Mar 11, 2022 • 5 tweets • 2 min read
I was toying around on charts and was inquisitive today.
This is NOTHING more than me just having some fun with some charts. That's it. Not a prediction. Just showing time overlaid.
In the 2018 bear market for Bitcoin, it took *332 days* from when the peak hit, until it started to capitulate.
If we drew that from the day Coinbase IPO'd, which was a 6-month top, and the height of On Chain activity and Retail Investor FOMO, we're on *day 331*.
Feb 24, 2022 • 12 tweets • 4 min read
This is a pretty climatic moment. I'm not a geopolitical expert or capable of solving 5D chess that gets played during wartime situations. But, we can look at how the charts are reacting to this.
It appears Bitcoin is now deviating from it's 5.5 month structure.
1/12
At the same time that this is all occurring, significant things are happening market wide. For example, in 2014, this was OIL's breakdown level. 5-years of higher lows, then it crashed from here. This moment has caused OIL to break through that resistance.
2/12
Jan 16, 2022 • 5 tweets • 2 min read
1/ Tinfoil hat time, because we're about to dive into the Verge chart Vs. Bitcoin in 2017. And... something going on with Litecoin.
This was the setup the XVG/BTC chart had heading into December of 2017. This chart spans a timeframe of about 7-months, before the mega pump. 
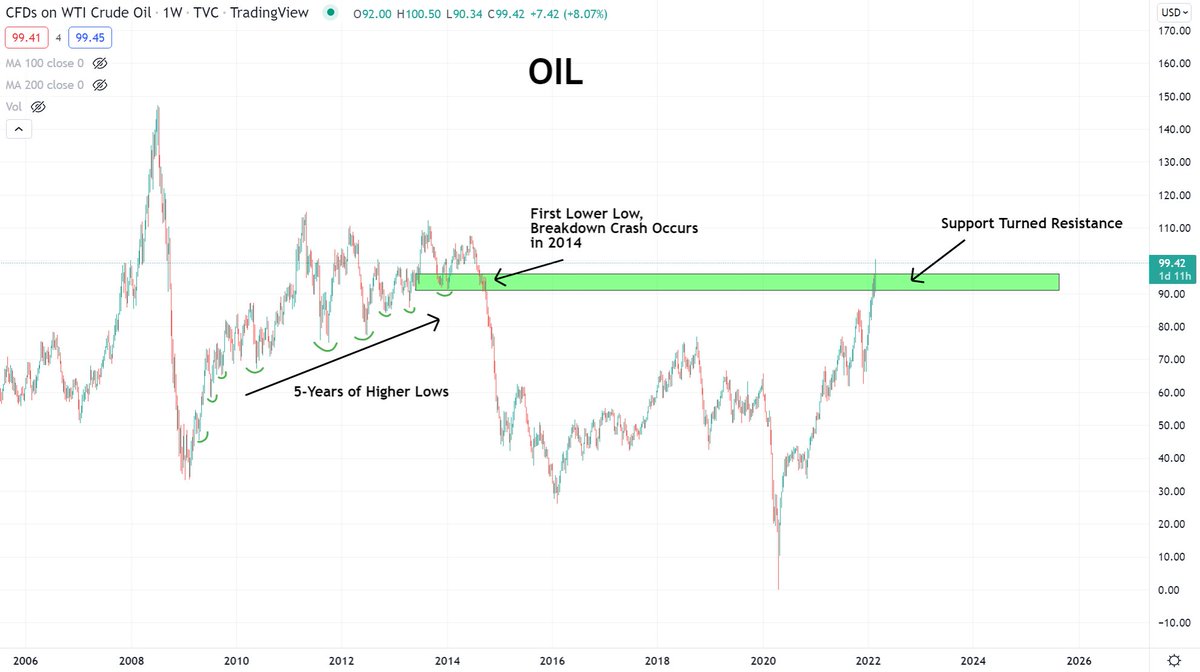
2/ And, as strange as it seems, on the scale of nearly 8-years, Litecoin has printed a similar structure vs Bitcoin.
Oct 16, 2021 • 25 tweets • 7 min read
I believe the top of Bitcoin is the most likely to occur around $72,000-$75,000, leading into a multi-year bear market.
In this thread, I will present my case as to why I believe this.
I want to preface this by saying I've been a bull on Bitcoin for the entirety of my YouTube channel, established in 2019, with 550+ videos published. I was also bullish on Bitcoin during this most recent pullback of Bitcoin in May, June, and July, expecting new All Time Highs.
Oct 13, 2021 • 4 tweets • 2 min read
Thanks for coming out to the livestream. With having technical difficulties, I feel I owe a synopsis of what it was about.
Bitcoin is fighting back above the 0.786 heading into the daily close, still looking for a touch above the B-Wave:
1/4
The Total Market Cap of all of crypto has touched above the September 7th top, on "El Salvador" day. Fighting to breakout the cup and handle:
2/4
May 16, 2021 • 4 tweets • 2 min read
The XRP community is pretty excited right now. So, I'm just throwing this out there to show what's been happening.
Remember, we are still in a range.
1/3
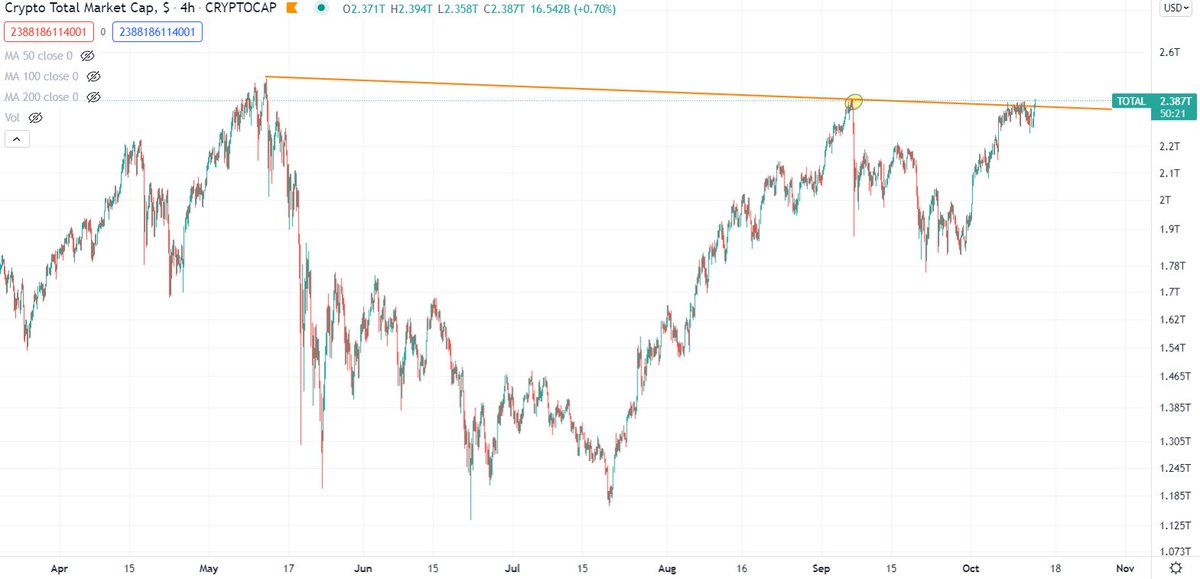
And, the price action over the last day has been a 0.702 retrace of the down move from April 6 - April 12.
Ranges can be brutal. And they can take a long time, revisiting the upper and lower boundaries. As for breakouts on the USD chart, we don't have any just yet.
2/3
May 15, 2021 • 4 tweets • 1 min read
This is the most "Fear" we have seen in the crypto market in the last 13-months.
Leaving this hear to revisit it later:
Bitcoin = $48,300.
Three days ago, Elon Musk said he won't accept Bitcoin for Tesla vehicles.
Yesterday, Jack Dorsey said Square won't be buying Bitcoin any longer.
Months of euphoric narratives, then, sudden climate change shift.