
Super excited to introduce a new set of transparency related improvements on @smallcaseHQ For every smallcase, we have introduced a new section called cost calculator. Here is how this will work (1/6)
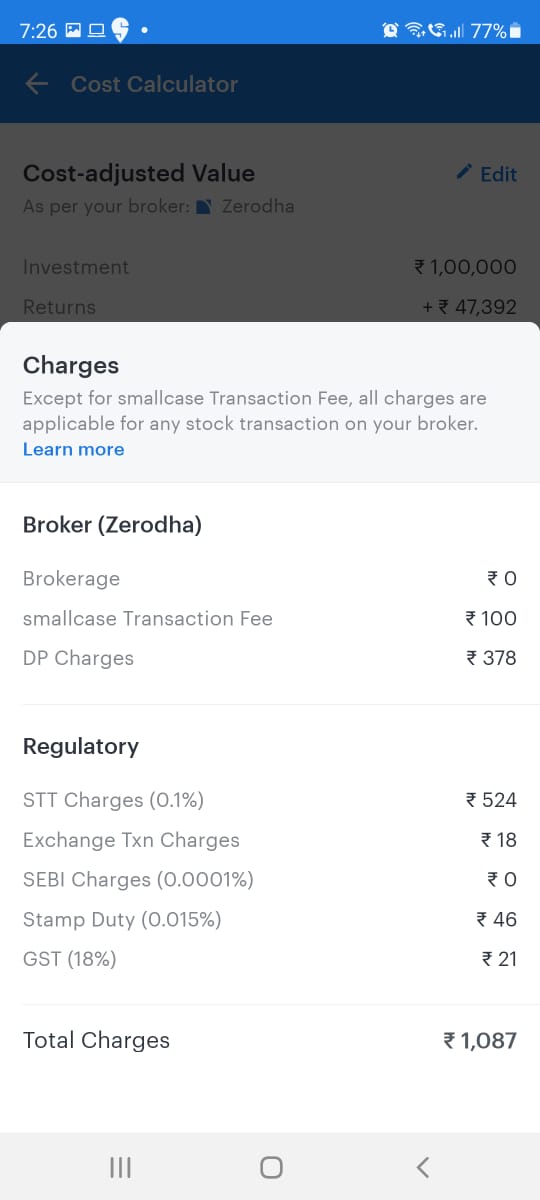
You can access this section from the performance chart on the smallcase page. On the top you would be able to see the returns generated and cost incurred in the real world scenario on the live data of smallcase, based on the charged levied by your broker (2/6) 

You can also see and compare the graph of how your investment would have moved in the real world scenario vs the unadjusted performance. The difference will be higher for frequently rebalanced smallcases vs smallcases with longer review periods (3/6)
By clicking on the info icon against charges, you can access the detailed breakup of charges like DP, STT, Brokerage etc (4/6)
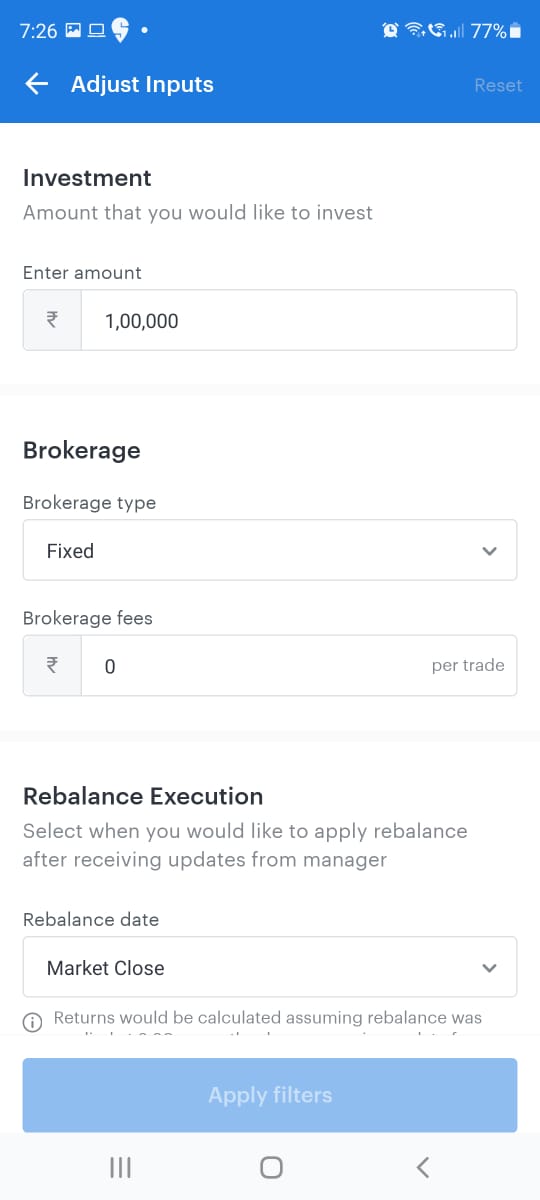
You can also edit the inputs like investment amount, brokerage plan to see the real life simulation of your planned investment. We also give an option to pick a rebalance execution time. Users can use this to understand the impact of delayed rebalance execution on returns (5/6)
Yes, we know you want more features like XIRR, nudges for smallcases with illiquid stocks etc. We are on a mission to make smallcases the most transparent investment product class and are already working on these features (6/6)
smallcase.com/blog/charges-a…
smallcase.com/blog/charges-a…
• • •
Missing some Tweet in this thread? You can try to
force a refresh


