Zeke Hausfather Profile picture
Oct 19, 2021 17 tweets 6 min read Read on X
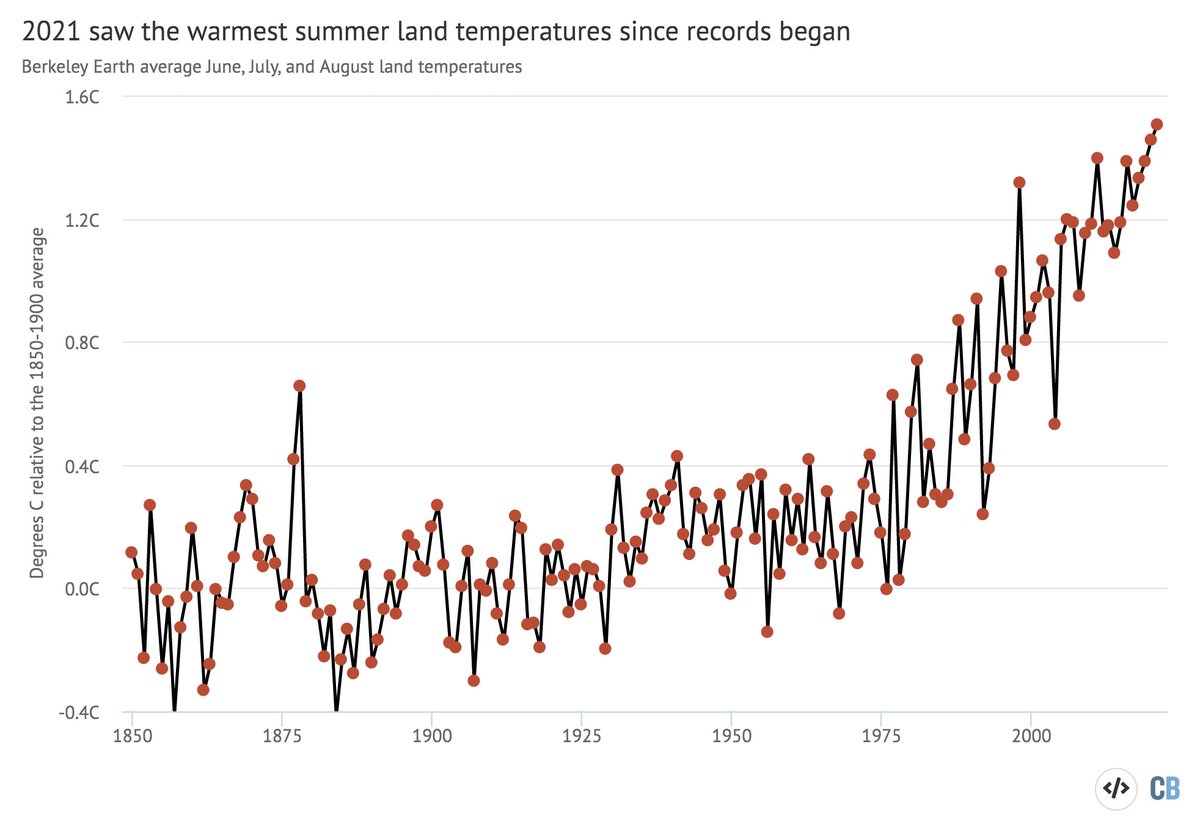
2021 saw the warmest summer for the Earth's land regions, and is on track to be between the 5th and 7th warmest year since records began in the mid-1800s. For an update on temps, models, GHGs, and sea ice see our @CarbonBrief Q3 State of the Climate: carbonbrief.org/state-of-the-c…
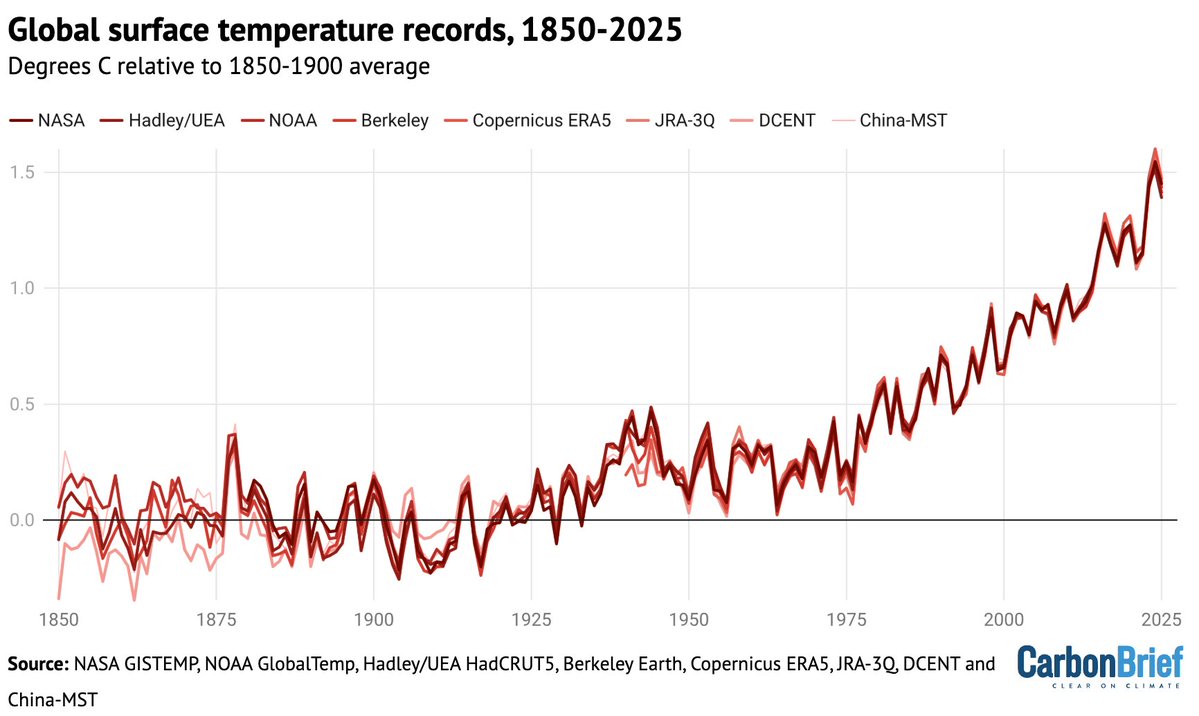
Summer land temperatures were relatively flat until 1975, with only around 0.2C warming up to that point. Today, summer land temperatures are around 1.5C above pre-industrial levels, with around 1.3C of that warming happening in just the past 45 years.
NW North America, Eastern Europe, Middle East, Northern Africa, and Siberia all had an exceptionally warm summer. China, sub-Saharan Africa, South America and Australia were modestly above average, while parts of Central America and India were below average.
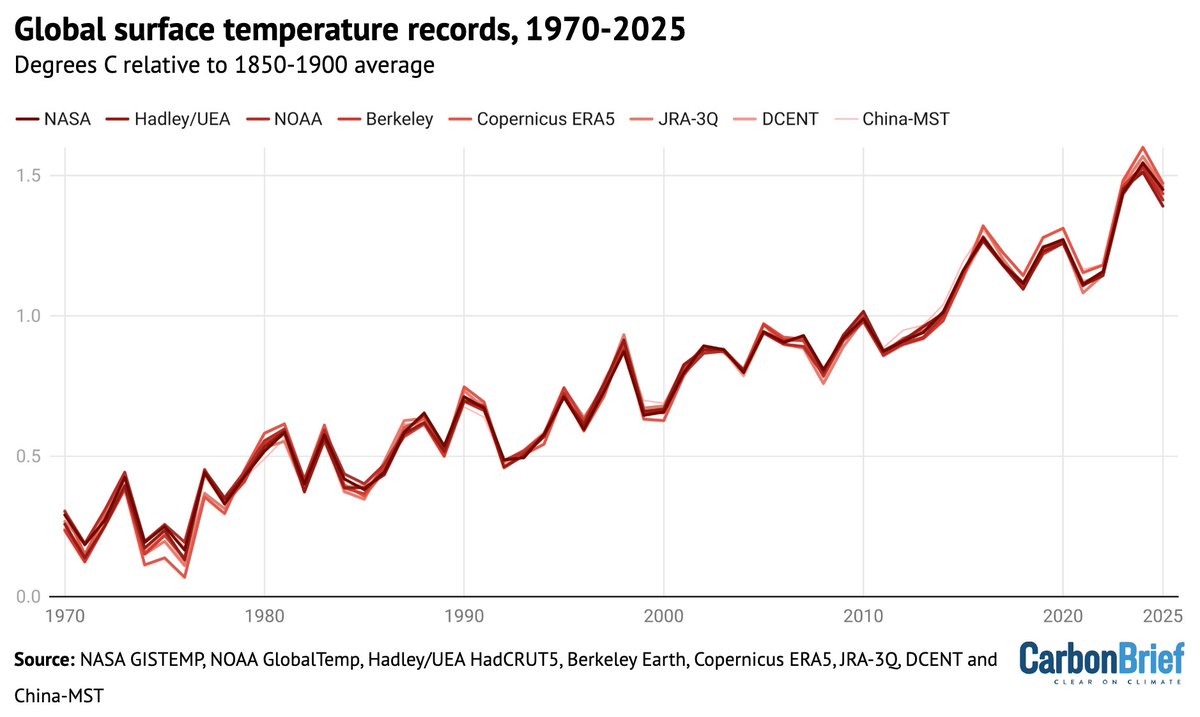
The figure below shows the temperature anomalies – changes relative to the 1981-2010 average temperature – for each year since 1970, along with the average over the first nine months of 2021.
So far, 2021 is tied for the 5th warmest to date with 2015 and 2018. It had a cooler start than those years, but warmer temperatures over the past few months have pushed year-to-date values upwards. However, there is a growing La Niña event in the tropical Pacific.
The table below shows how each month in 2021 ranked across all the datasets examined – with “2nd” indicating the second warmest temperature on record for that month occurred in 2021.
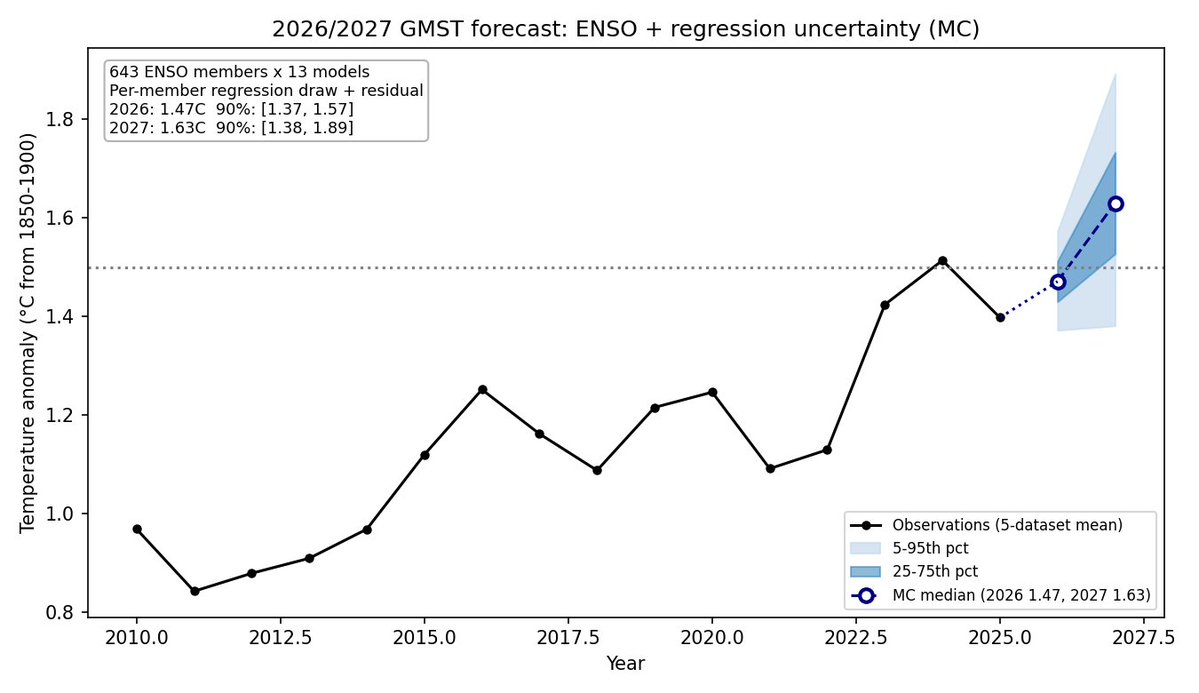
El Niño and La Niña events – collectively referred to as the El Niño Southern Oscillation, or ENSO – are the main driver of year-to-year variation on top of the long-term surface warming trend. El Niño years tend to be warmer than average, while La Niña years tend to be cooler.
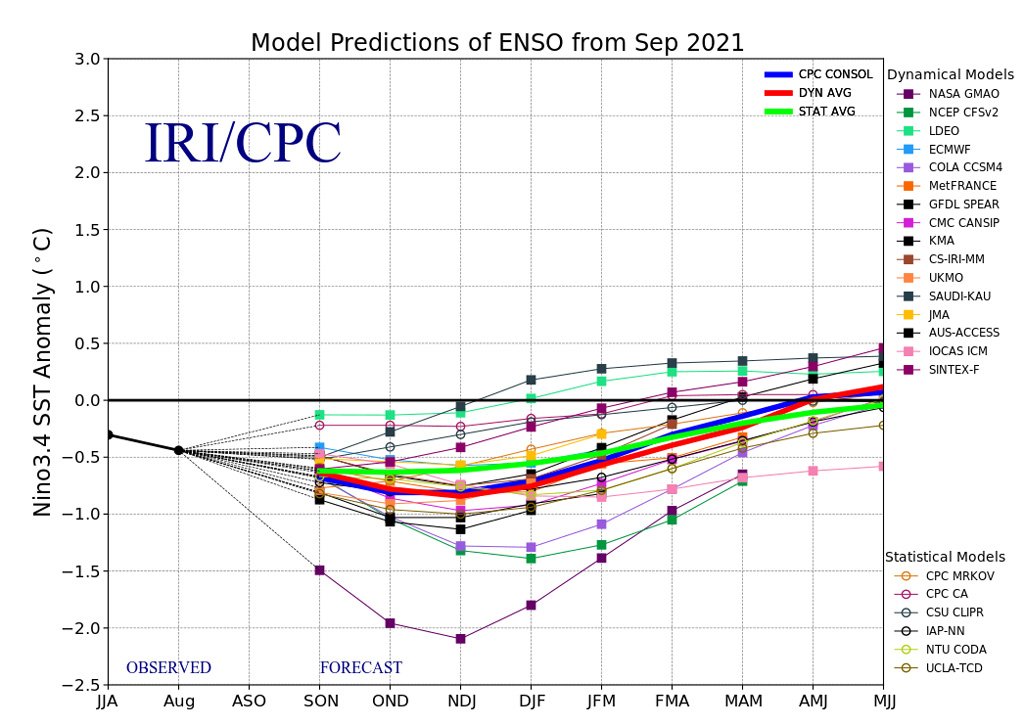
La Niña conditions have played a role in cooler 2021 temps. Models now forecast modest-to-moderate La Niña conditions will persist through first quarter of 2022. This may result in 2022 being a bit cooler than the past few years as well, though it is too early to know for sure.
Using the data from the first nine months of the year, plus both past and forecast future ENSO conditions, Carbon Brief has produced a prediction of where 2021 temps will most likely land for different surface temperature records. (Hadley/Berkeley will be added when available).
The figure below shows the 2021 to-date temperatures and annual 2021 projected temperatures (with uncertainties) for Copernicus/ECMWF’s ERA5, along with the long-term temperature trend based on data from 1979-2020.
While 2021 temperatures will be lower than many of the past few years, they are quite consistent with the longer-term warming trend due to human emissions of CO2 and other greenhouse gasses.
With each month of additional data, the uncertainty in the expected 2021 annual temps shrinks as there are fewer remaining months to change the average. The figure below illustrates this, showing that both the best estimate (red) and uncertainty range (black whiskers) over time:
Global temperatures have been well in-line with climate model projections from the generation of models used in the IPCC 5th Assessment Report (CMIP5). We will be showing a comparison with the new warming projections in the AR6 in our year-end review.
Human emissions of greenhouse gases have increased atmospheric concentrations of CO2, methane and nitrous oxide to their highest levels in at least a few million years – if not longer.
Arctic sea ice extent was at low levels for much of the first half of 2021, setting new records in parts of both June and July. The summer minimum was the 12th lowest on record. Average Arctic sea ice to-date (first 289 days of the year) is the 9th lowest on record.
For more details (and interactive charts and graphs!) see our Carbon Brief article: carbonbrief.org/state-of-the-c…
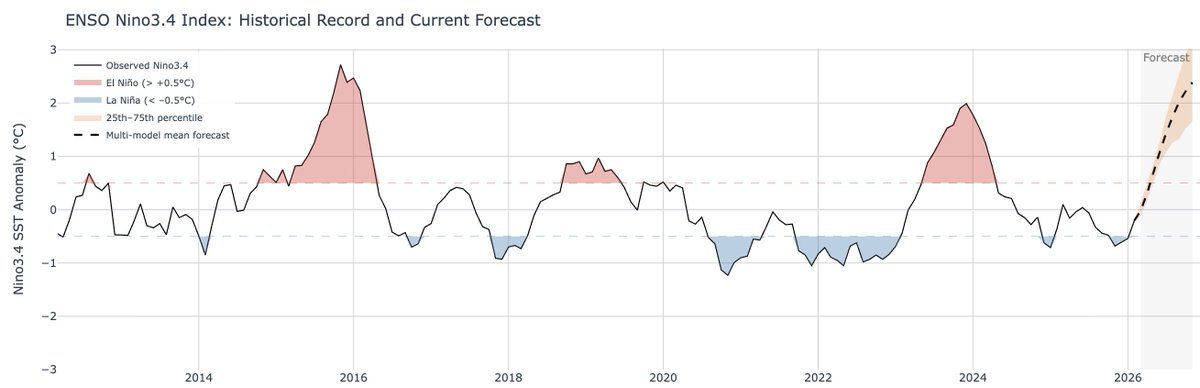
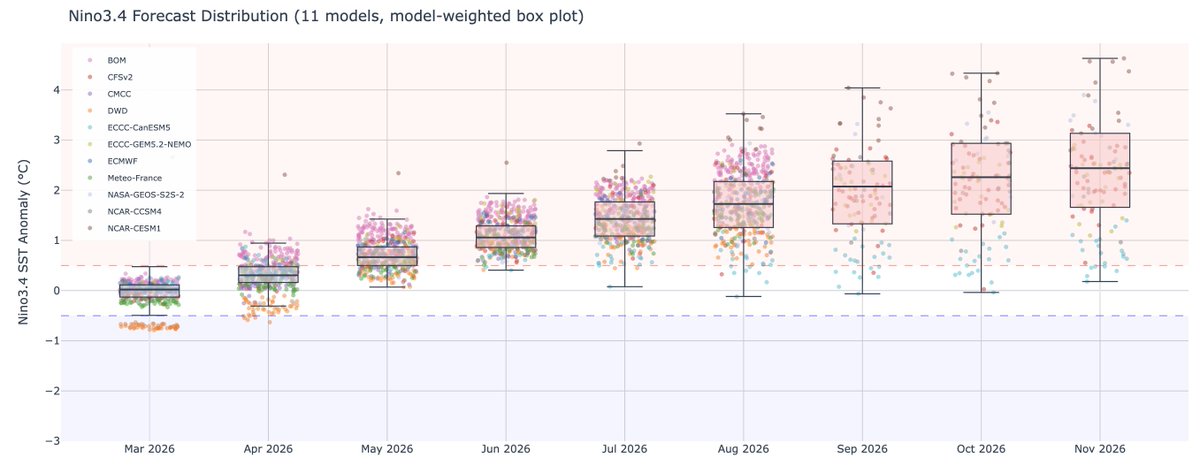
And literally an hour after I post this the October ENSO plume models are out. Still projecting a moderate winter La Nina:

• • •

Missing some Tweet in this thread? You can try to force a refresh
 

Keep Current with Zeke Hausfather

Zeke Hausfather Profile picture

Stay in touch and get notified when new unrolls are available from this author!

Read all threads

This Thread may be Removed Anytime!

PDF

Twitter may remove this content at anytime! Save it as PDF for later use!

Try unrolling a thread yourself!

how to unroll video
  1. Follow @ThreadReaderApp to mention us!

  2. From a Twitter thread mention us with a keyword "unroll"
@threadreaderapp unroll

Practice here first or read more on our help page!

More from @hausfath

Jul 24
We just published our State of the Climate Q2 update over at @CarbonBrief:

⬆️ Now a ~95% chance 2024 will be the warmest year on record.
⬆️ 13 month streak of records set between June 2023 and June 2024.
⬆️ July 22nd 2024 was the warmest day on record (in absolute terms).
⬇️ July 2024 will very likely come in below July 2023, breaking the record streak.
⬇️ The rest of 2024 is likely to be cooler than 2023 as El Nino fades and La Nina potentially develops.
⬇️ Second lowest Antarctic sea ice on record.carbonbrief.org/state-of-the-c…Image
The past 13 months have each set a new record, with 2024 being quite a bit warmer than 2023 (at ~1.63C above preindustrial levels) in the ERA5 dataset: Image
However, the margin by which records are being set has shrunk; global temperatures were setting new records by a stunning 0.3C to 0.5C in the second half of 2023, but have been breaking the prior records (set in 2016, 2020, or 2023) by only 0.1C to 0.2C this year: Image
Read 7 tweets
Jul 17
Global surface temperatures from @BerkeleyEarth are now out for June. It was the warmest June on record for land, oceans, and the globe as a whole by a sizable margin (~0.14C), and came in at 1.6C above preindustrial levels. berkeleyearth.org/june-2024-temp…
Image
This was the 13th consecutive record setting month, and the 12th month in a row above 1.5C: Image
The exceptional nature of recent global temperatures really stands out when we look at a 12-month moving average: Image
Read 7 tweets
Jul 3
Global temperatures were extremely hot in June 2024, at just over 1.5C, beating June 2023's previous record-setting temperatures by 0.14C and coming in around 0.4C warmer than 2016 (the last major El Nino event).

Now 2024 is very likely to beat 2023 as the warmest year on record Image
June 2024 was so warm that – in the absence of 2023's exceptional warmth – it would have beaten any past July as the warmest absolute monthly temperature experienced by the planet in the historical record: Image
This plot shows how June 2024 stacked up against all the prior Junes since 1940 in the ERA5 dataset: Image
Read 6 tweets
Jun 27
We’ve long talked about the carbon budget, but given that the world is on track to pass the 1.5C target in the coming decade its time to start talking about the "carbon debt".

My latest piece over at The Climate Brink: theclimatebrink.com/p/the-growing-…
Carbon dioxide accumulates in the atmosphere where it lasts for an extremely long time. While about half of our emissions are removed by land and ocean carbon sinks over the first century, it takes on the order of 400,000 years for nature to fully remove a ton of CO2. Image
But it turns out that the warming from our CO2 emissions is also extremely long lived. Even if global CO2 emissions ceased and atmospheric CO2 concentrations began to decline, the warming from those emissions would remain for millennia: pnas.org/doi/full/10.10…
Read 6 tweets
Jun 13
Recently we've seen a vibrant debate on when the world will firmly pass 1.5C.

Over at @CarbonBrief I weigh in with a new analysis, finding that it will most likely occur in the late 2020s or early 2030s in a world where emissions do not rapidly decrease. carbonbrief.org/analysis-what-…
Image
Global temperatures in any given year reflect short-term natural variability on top of longer-term human-driven warming. For example, a big El Niño or La Niña event can result in global temperatures up to 0.2C warmer or cooler, respectively, than they would otherwise be. Image
While there is no formal definition how the 1.5C goal is measured, it is generally interpreted to refer to long-term, human-driven warming.

For example, the IPCC uses the midpoint of a 20-year period as a way to avoid overinterpreting short-term natural variability.
Read 13 tweets
May 25
There is something of a genre of very online individuals™ discovering stratospheric aerosol injection and proclaiming it as a low-cost solution to climate change. Spoiler alert: its not.

In this case the thread uses a bunch of my figures so its worth responding.
Climate change is driven primarily by our emissions of carbon dioxide. We've emitted a lot of CO2: around 2.5 trillion tons since 1750, or the weight of the the biosphere and everything humans have ever built combined theclimatebrink.com/p/the-staggeri…
Image
This CO2 remains in the atmosphere for a long time; it takes well over 100k years for a ton of CO2 emitted today to be fully removed. The warming caused by CO2 also sticks around; a ton emitted today will continue to warm the planet for millennia: pnas.org/doi/full/10.10…
Image
Read 11 tweets

Did Thread Reader help you today?

Support us! We are indie developers!


This site is made by just two indie developers on a laptop doing marketing, support and development! Read more about the story.

Become a Premium Member ($3/month or $30/year) and get exclusive features!

Become Premium

Don't want to be a Premium member but still want to support us?

Make a small donation by buying us coffee ($5) or help with server cost ($10)

Donate via Paypal

Or Donate anonymously using crypto!

Ethereum

0xfe58350B80634f60Fa6Dc149a72b4DFbc17D341E copy

Bitcoin

3ATGMxNzCUFzxpMCHL5sWSt4DVtS8UqXpi copy

Thank you for your support!

Follow Us!

:(