Scotland: 2021 mortality through week 41 (NRS)
1/ Overall
Sadly another high week. Week 40 was revised up (+32% from 5yr), and week 41 was +23%.
Having been below normal in spring, now 21 consecutive weeks not only above the 5 year average, but ever higher above.
1/ Overall
Sadly another high week. Week 40 was revised up (+32% from 5yr), and week 41 was +23%.
Having been below normal in spring, now 21 consecutive weeks not only above the 5 year average, but ever higher above.

2/ Rank
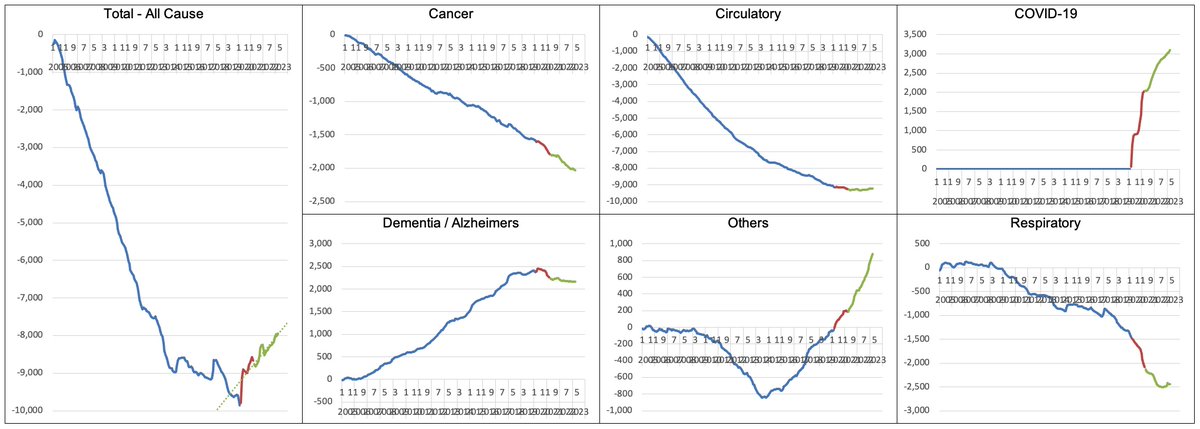
With data context is always critical, and we should be clear neither this (nor indeed 2020) are anything not experienced before. 2021 to date ranks 11th in mortality rate in even the past 30 years. The key is the big rise from last summer.
(No need to mention the 90s!)
With data context is always critical, and we should be clear neither this (nor indeed 2020) are anything not experienced before. 2021 to date ranks 11th in mortality rate in even the past 30 years. The key is the big rise from last summer.
(No need to mention the 90s!)

3/ Excess mortality by cause
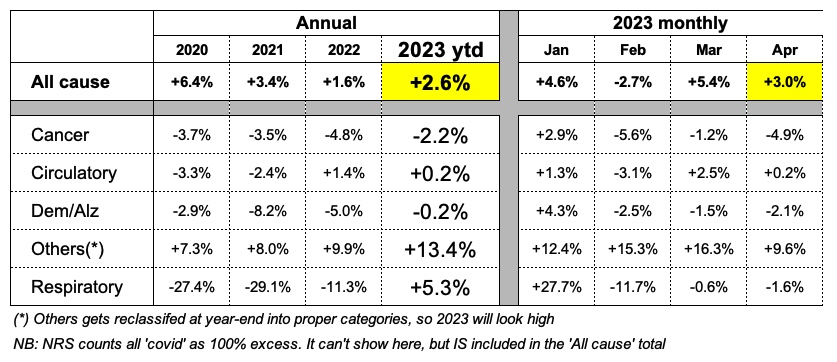
‘Deaths within 28 days of a positive test’ continues to make up a notable proportion of the excess, albeit less than 50%. Those numbers - both total excess and 'with covid’ - are far higher than the corresponding period last year.
‘Deaths within 28 days of a positive test’ continues to make up a notable proportion of the excess, albeit less than 50%. Those numbers - both total excess and 'with covid’ - are far higher than the corresponding period last year.

4/ Excess mortality by location
The care home excess that appeared last week has normalised again. We still see excess in hospital location, and ‘excess death at home’ continues to make up the largest proportion.
The care home excess that appeared last week has normalised again. We still see excess in hospital location, and ‘excess death at home’ continues to make up the largest proportion.

5/ Total mortality by age
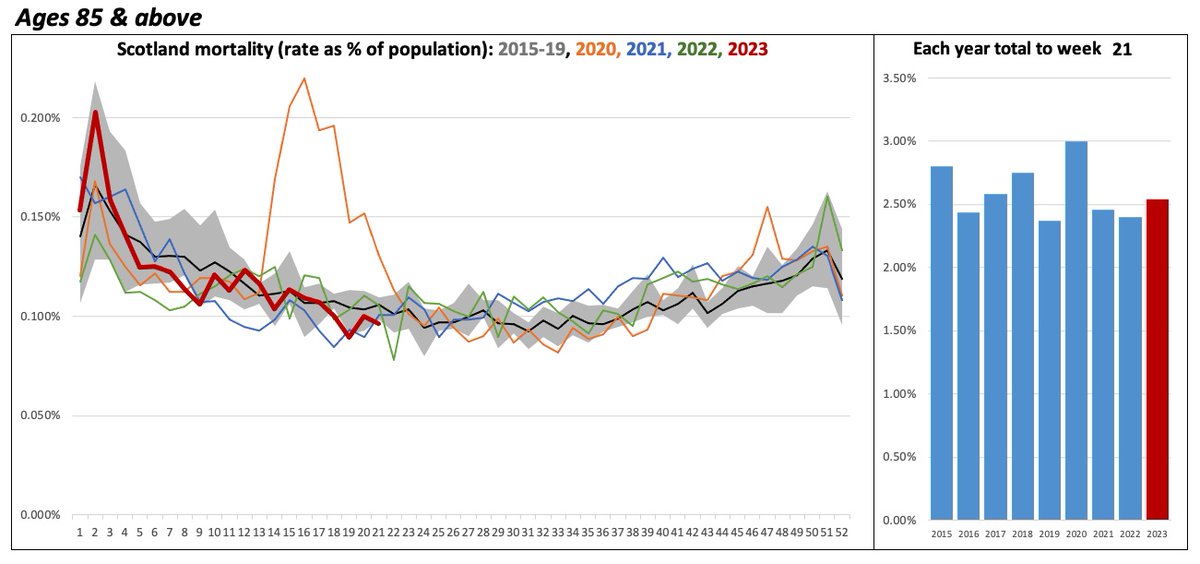
Continuing excess in all age groups above 15-44. The uptrend in 45-64 seems to be accelerating, as we saw earlier in the older age groups (85+, then 75-84, then 65-74). Hope to see these settle soon.
Continuing excess in all age groups above 15-44. The uptrend in 45-64 seems to be accelerating, as we saw earlier in the older age groups (85+, then 75-84, then 65-74). Hope to see these settle soon.

6/ Cumulative summer excess, by age group
This shows more clearly the ongoing trend by each age group, and how the rises are ‘staged’ over time, starting in age order.
All trends continue, but 45-64 showing more of a rise.
This shows more clearly the ongoing trend by each age group, and how the rises are ‘staged’ over time, starting in age order.
All trends continue, but 45-64 showing more of a rise.

7/ Combined excess
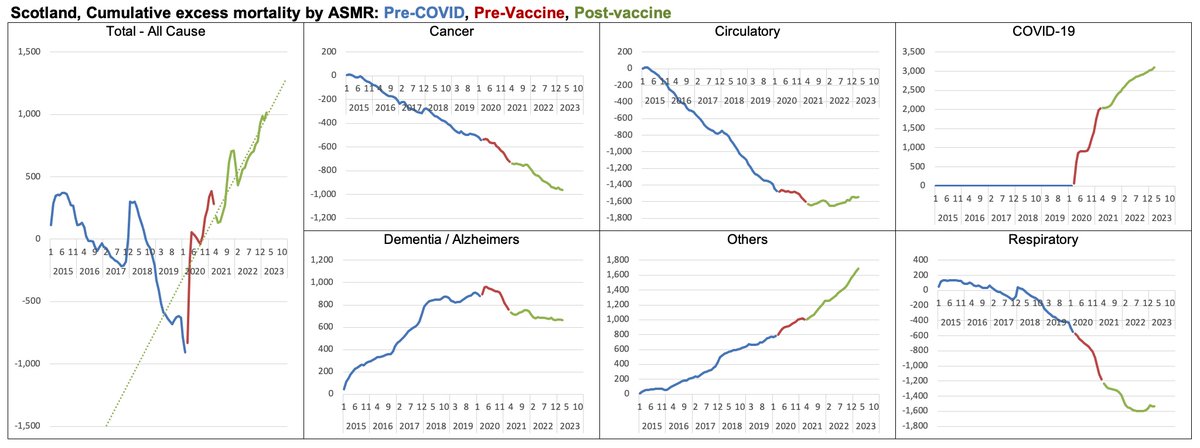
Combining the summer excess mortality, it is now 2,763 above the 5 year average. This is comprised of
- Mainly ‘others’, then respiratory/c19, circulatory, cancer
- Occurring at home
- Higher by older age group
Combining the summer excess mortality, it is now 2,763 above the 5 year average. This is comprised of
- Mainly ‘others’, then respiratory/c19, circulatory, cancer
- Occurring at home
- Higher by older age group

9/ Child mortality (<1 year)
Last week the ‘quarterly average’ showed a high, as it was an average of 1 week and that week happened to be a real high. This week is much lower, which brings the moving average down (both highlighted).
That said, still a high trend level here.
Last week the ‘quarterly average’ showed a high, as it was an average of 1 week and that week happened to be a real high. This week is much lower, which brings the moving average down (both highlighted).
That said, still a high trend level here.

10/ Child mortality (1-14 years)
Running fairly normally. These are very low numbers (which is good!!), so it’s very easy to get volatile peaks and troughs.
Running fairly normally. These are very low numbers (which is good!!), so it’s very easy to get volatile peaks and troughs.

11/ Regional
Looking at the data different ways to see if there are patterns, or if patterns break down (either of which can be informative).
This is cumulative mortality change through the summer by region, but the trend change we see is rather consistent across regions (so far)
Looking at the data different ways to see if there are patterns, or if patterns break down (either of which can be informative).
This is cumulative mortality change through the summer by region, but the trend change we see is rather consistent across regions (so far)

12/ Summer summary
Overall this summer not only continues far worse than last summer, but the *trend* is worsening rather than flattening or improving.
Whereas 2020 was +1.1% from 5yr (more or less normal), 2021 is +14.5%.
Second chart shows that in context to past 40 years.

Overall this summer not only continues far worse than last summer, but the *trend* is worsening rather than flattening or improving.
Whereas 2020 was +1.1% from 5yr (more or less normal), 2021 is +14.5%.
Second chart shows that in context to past 40 years.


• • •
Missing some Tweet in this thread? You can try to
force a refresh


