🧵Continuing the tweet the paper pubmed.ncbi.nlm.nih.gov/34620522/ into the diastasis: At end of early filling, the vortex fills most of the ventricle.
1/ The intraventricular vortex fills the ventricle, and the downwards flow in the septal part, will close the anterior MV leaflet. This also isolates the vortex in the ventricle, which may conserve the kinetic energy in the vortex
2/ At the end of diastasis, the lateral part of the vortex, with apical flow, is aligned with the incoming inflow in atrial systole, adding momentum and kinetic energy to the inflow during atrial systole.
3/At the start of late inflow, simultaneous with mitral re opening, there is onset of a new phase of basal AV-plane motion.
4/ The basal motion of the AV-plane again will expand the LVOT, diverting blood towards the septum and downwards, creating a new vortex similarly to the early filling, which also originates near the ventricular base.
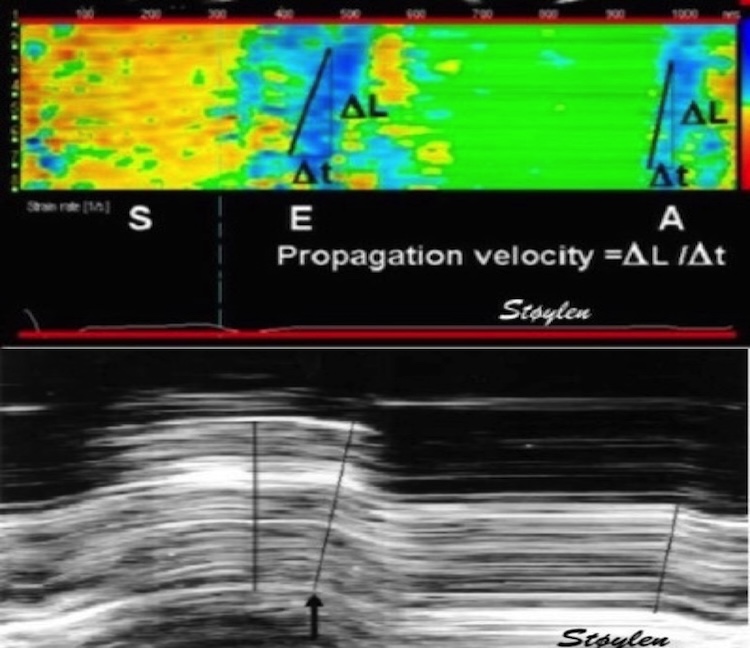
5/ This again creates into the LVOT, immediately before ejection. Earlier described as the “J-wave” pubmed.ncbi.nlm.nih.gov/2372400/, though incorrectly taken as return of the E-wave via apex, it was correctly, but inconsistently related the peak of the signal as related to the A-wave.
6/ It was later ascribed to early return of the A-wave, with a transit time of 20 - 80 ms, compared to 80 - 200 ms for the E_LVOT. pubmed.ncbi.nlm.nih.gov/8160627/ Although not evaluated in our study, it seems to be reasonable that the E_LVOT/A_LVOT ratio is related to the E/A ratio.
7a/ In a recent publication the A_LVOT was described as “pre systolic flow”, , reported in only a fraction of patents, irrespective of EF, but presence associated with worse prognosis. pubmed.ncbi.nlm.nih.gov/25440501/
7b As the amplitude of the A_LVOT is associated with the E/A ratio, low detection of A_LVOT may be related to the amplitude, creating a bias in detection towards a high E/A ratio, and thus being a confounder
8/ While the septal part of the early vortex seems to weaken, inflow in the A wave aligns with the lateral part, as the same time as the new vortex expands towards the apex.
9/ At the end of late filling, electromechanical activation creates a short duration apical motion before MVC, as published pubmed.ncbi.nlm.nih.gov/34184410/ and tweeted earlier
10/ At the same time, the vortex from the late inflow has a basal flow along the septum, directed towards the anterior mitral leaflet, that also may assist in MVC, as suggested previously.

• • •

Missing some Tweet in this thread? You can try to force a refresh
 

Keep Current with 🇳🇴🇩🇰Asbjørn Støylen 🇺🇦🇵🇸

🇳🇴🇩🇰Asbjørn Støylen 🇺🇦🇵🇸 Profile picture

Stay in touch and get notified when new unrolls are available from this author!

Read all threads

This Thread may be Removed Anytime!

PDF

Twitter may remove this content at anytime! Save it as PDF for later use!

Try unrolling a thread yourself!

how to unroll video
  1. Follow @ThreadReaderApp to mention us!

  2. From a Twitter thread mention us with a keyword "unroll"
@threadreaderapp unroll

Practice here first or read more on our help page!

More from @strain_rate

Jun 18
🧵On the Wiggers diagram. It is an illustration of temporal relations of atrial, ventricular and aortic pressures with ventricular volumes, in a simplified, schematic illustration of the main relations, for basic teaching purposes, but is not the full truth about physiology. Image
The full picture is far more complex, the typical version of the Wiggers diagram as shown here, do not show the effects of inertia of blood, the knowledge from newer physiological studies with high-fidelity catheters, nor from Doppler and TDI. Let’s look at what’s missing.
#1 The atrioventricular pressure curves cross over in the middle of atrial systole, reversing the gradient from positive to negative, as documented by
Carmeliet;
Appleton: pubmed.ncbi.nlm.nih.gov/2208210/
pubmed.ncbi.nlm.nih.gov/9362417/
Image
Read 15 tweets
Jun 6
🧵on ventricular ejection. Does blood always flow downwards a pressure gradient? Certainly not. A pressure gradient accelerates stagnant blood to flow down the gradient, but blood in motion may flow against the pressure gradient (by inertia), being decelerated. Image
2/ It was shown in the early 60ies that the pressure gradient from LV to Aorta was positive only during early ejection, and then negative during most of ejection. Pressure crossover occurred earlier than peak pressure. pubmed.ncbi.nlm.nih.gov/13915694/
Image
3/ The negative gradient after pressure crossover would then decelerate LV outflow, so peak flow must be at pressure crossover. As flow = rate of LV volume decrease, peak rate of volume decrease mus also be: - later that AVO (due to the acceleration) - before peak pressure Image
Read 10 tweets
Apr 18
Old misconceptions become as new. A 🧵 A recent paper focusses on pre ejection velocities as a contractility measure. In addition, the authors maintain that these velocities are isovolumic contraction, which they also maintain, is load independent. pubmed.ncbi.nlm.nih.gov/37816446/
All three concepts are wrong. True, the peak contraction velocity (peak rate of force development) occurs before AVO, and thus is afterload independent. But it's not preload independent and thus not a true contractility measure. pubmed.ncbi.nlm.nih.gov/13915199/
Image
2/ Peak RFD corresponds to peak dP/dt, which is during IVC,m but closest to the AVO. pubmed.ncbi.nlm.nih.gov/5561416/
Image
Read 13 tweets
Apr 14
🧵 on atrial systole. 1/ Already in 2001, did we show that both the early and late filling phase was sequential deformation propagating from the base to the apex. pubmed.ncbi.nlm.nih.gov/11287889/
Image
2/ This means, both phases consist of a wall elongation wave, generating an AV-plane motion away from the apex. So what are the differences? Image
3/ Only e’ correlates with MAPSE, so the elastic recoil is finished in early systole, while a’ do not, so atrial systole is a new event, caused by the next atrial contraction. pubmed.ncbi.nlm.nih.gov/37395325/
Read 12 tweets
Apr 10
🧵1/ Sorry, I accidentally deleted the first tweet in this thread, here is a new and slightly improved version. Looking at the physiology of AVC propagation velocity, there are confounders galore, so taking it as a marker of fibrosis, is premature, to put it mildly.
2/ Firstly, The AVC is an event of onset of IVR, i.e at a part of heart cycle with relatively high cavitary and myocardial pressure. This may contribute to wall stiffness, which again may affect (probably increase) wave propagation velocity. Image
3/ Secondly, This may affect AS patients; who may have a higher wall/cavity pressure at end systole than controls, and thus higher pressure related stiffness.
Read 11 tweets
Apr 10
🧵1/ Looking at the physiology of AVC propagation velocity, there are confounders galore, so taking it as a marker of fibrosis, is premature, to put it mildly.
2/ Firstly, The AVC is an event of onset of IVR, i.e at a part of heart cycle with relatively high cavitary and myocardial pressure. This may contribute to wall stiffness, which again may affect wave prpagation velocity.
3/ Secondly, AS patients may have a higher wall/cavity pressure at end systole than controls, and thus higher pressure related stiffness.
Read 7 tweets

Did Thread Reader help you today?

Support us! We are indie developers!


This site is made by just two indie developers on a laptop doing marketing, support and development! Read more about the story.

Become a Premium Member ($3/month or $30/year) and get exclusive features!

Become Premium

Don't want to be a Premium member but still want to support us?

Make a small donation by buying us coffee ($5) or help with server cost ($10)

Donate via Paypal

Or Donate anonymously using crypto!

Ethereum

0xfe58350B80634f60Fa6Dc149a72b4DFbc17D341E copy

Bitcoin

3ATGMxNzCUFzxpMCHL5sWSt4DVtS8UqXpi copy

Thank you for your support!

Follow Us!

:(