Lion Profile picture
Oct 24, 2021 8 tweets 3 min read Read on X
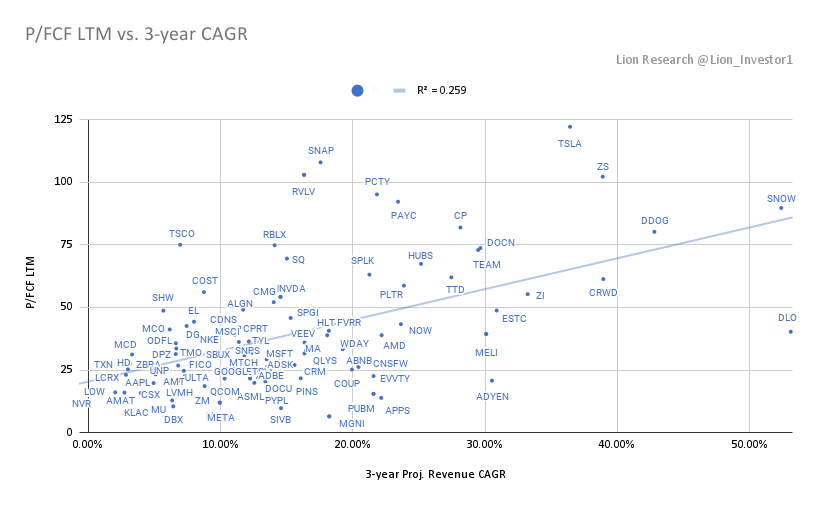
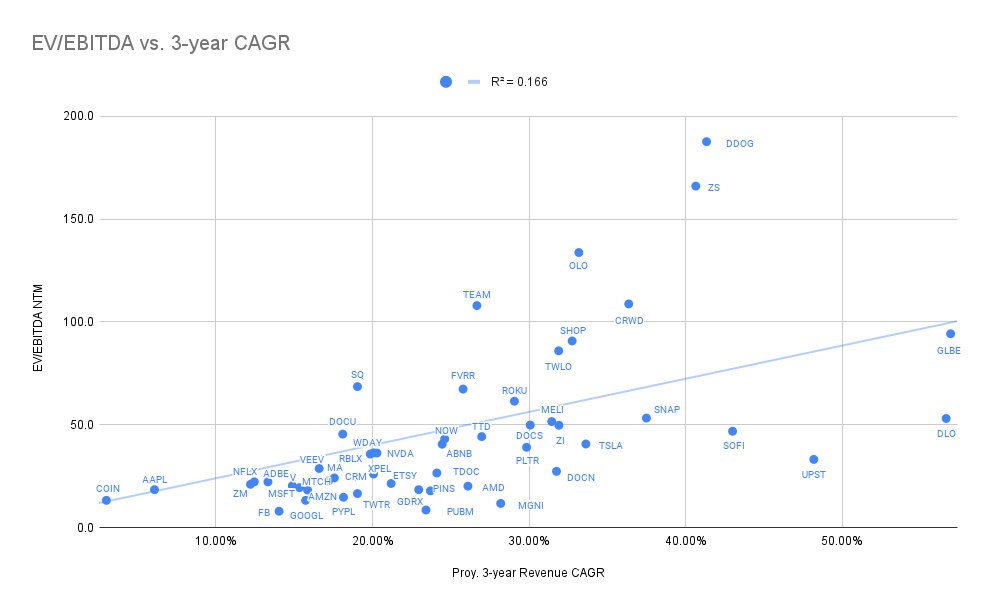
After an interesting and volatile start to the Q3 earnings season, we can see where valuation multiples stand for technology companies.

This is the consolidated graph with all the companies comparing EV/GP NTM vs estimates of 3-yr revenue growth:
E-Commerce
EV/GP NTM

$AMZN 8.1x
$BABA 7.9x
$SE 37.5x
$MELI 22.9x
$JD 4.9x
$W 6.0x
$SHOP 61.2x
$CPNG 10.7x
$ETSY 16.5x
$PDD 10.2x
$OZON 7.1x
$BIGC 18x
$GLBE 104x
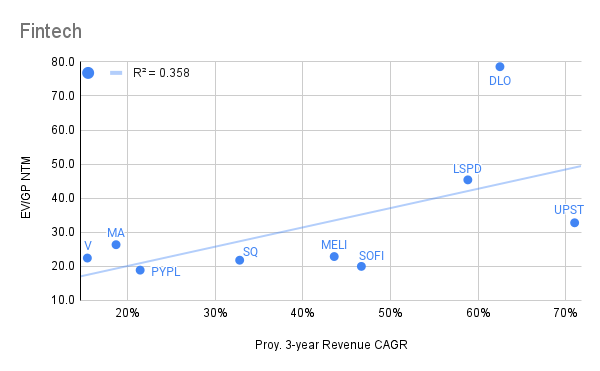
Fintech and Payments
EV/GP NTM

$V 22.4x
$MA 26.4x
$PYPL 18.9x
$SQ 21.8x
$AFRM 137x
$SOFI 20x
$UPST 32.8x
$LSPD 45.4x
$DLO 78.6x
Social Media and Digital Ads
EV/GP NTM

$FB 8.3x
$GOOGL 11.4x
$PINS 15.4x
$SNAP 28.7x
$TWTR 12.8x
$ROKU 24.3
$TTD 32.7
$MTCH 20.8x
$MGNI 9.9x
$PUBM 7.3x
Mega Cap
EV/GP NTM

$AAPL 15.4x
$MSFT 17.5x
$GOOGL 11.4x
$AMZN 8.1x
$FB 8.3x
$TCEHY 14.7x
$BABA 7.9x
$TSLA 53.2x
$NVDA 30.7x
$NFLX 21.6x
SaaS

$ADBE 19x
$ASAN 67x
$CRM 12.7x
$CRWD 49x
$DCBO 23x
$DDOG 58x
$DOCN 25x
$DOCU 28x
$ESTC 23x
$FSLY 25x
$LSPD 46x
$MDB 49x
$MNDY 55x
$MTTR 60x
$NET 98x
$NTNX 5.9x
$OKTA 34x
$OLO 27x
$PATH 28x
$PD 12.8x
$PLTR 31x
$SNOW 95x
$TEAM 50x
$TWLO 35x
$U 42x
$ZI 27x
$ZM 24x
$ZS 55x
Some of the biggest changes in this metric since 08/28:
⬆️
$NET 67x to 98x
$UPST 22x to 32x
$DDOG 42x to 58x

⬇️
$DLO 116x to 78.6x
$PYPL 26.3x to 18.9x
$ZM 33x to 24x
$OLO 36x to 27x
$SNAP 43.8x to 28.7x
$DOCU 35x to 28x
As we all know, valuation is one of many variables to take into account when investing. And this is only an easy way to visualize all these companies together.

Profitability/margins in lower rows of the income statement can vary widely.

Good luck to all in this Q3 season!! 🔥

• • •

Missing some Tweet in this thread? You can try to force a refresh
 

Keep Current with Lion

Lion Profile picture

Stay in touch and get notified when new unrolls are available from this author!

Read all threads

This Thread may be Removed Anytime!

PDF

Twitter may remove this content at anytime! Save it as PDF for later use!

Try unrolling a thread yourself!

how to unroll video
  1. Follow @ThreadReaderApp to mention us!

  2. From a Twitter thread mention us with a keyword "unroll"
@threadreaderapp unroll

Practice here first or read more on our help page!

More from @Lion_Investor1

Sep 4, 2022
This Q2 2022 earnings season is coming to an end so it is a good time to assess where valuations stand and how analyst have changed their expected growth for each company.

First, let’s compare P/FCF LTM vs 3-yr Revenue Growth for all companies:
Next, we see the comparison based on a P/E NTM basis vs 3-yr Revenue Growth for all companies.

Comparing valuation multiples from different industries should not be used as an investment decision driver, but it is an interesting exercise to have an overall current view:
We divided these companies on groups with similar companies based on their size, industry or type of business. Here is the first one:

1. Mega Cap Tech P/FCF LTM

$AAPL 23.3x
$GOOGL 21.7x
$META 12x
$MSFT 29.3x
$NVDA 54.2x
$TSLA 122.1x
Read 21 tweets
May 7, 2022
Investing Holy Grail:
Earnings growth x multiple expansion x share buybacks.

$DPZ last 10 years:
1. P/E 20 to 30 (1.5x)
2. Earnings: $105M to $510M (4.9x)
3. Bought back 40% of their shares (1.6x)

Total return: 1.5 x 4.9 x 1.6 = 11.8x
CAGR return: 29%

Other examples?
$ODFL

Past 10 years:
1. P/E 19 to 29 (1.53x)
2. $140M to $1034M (7.4x)
3. Bought back 10.4% of shares (1.13x)

Total return: 1.53 x 7.4 x 1.13 = 12.8x
CAGR return: 30%
$AAPL

Past 10 years:
1. P/E 17 to 26 (1.53x)
2. $25.9B to $94.7B (3.65x)
3. Bought back 37% of shares (1.59x)

Total return: 1.53 x 3.65 x 1.59 = 8.8x
CAGR return: 25%
Read 8 tweets
May 1, 2022
Valuations continue to decrease for high quality companies with high ROIC, that have delivered high CAGR returns over the years.

This is the comparison of the current NTM P/E versus the average 2010-2019 NTM P/E for these companies. Image
Below we can see where they were at the time and the evolution over the past month and a half.

At the time, 60% of companies where still over their historical multiples. Today, 47% are still over their historical multiples vs 53% below.

During the 2010-2019 period, the US 10-yr yield Treasury Note was usually between 2% and 3%.

Currently, we are at 2.94%. Interest rates act like gravity for valuation multiples so if the 10-yr yield continue to climb, valuation should compress further.
Read 5 tweets
Apr 22, 2022
Bears are currently in control in the growth sector.

Fundamentals matter little on the short term when a sector is out of favor, especially after a bubble.

For long term investors, some profitable growth companies are becoming more attractive with a 3+ year investment horizon:
These companies are profitable and they are getting closer or reaching lower multiples than more mature and established non-tech companies.

Of course, WS estimates can vary with actual execution over time so an assessment of quality is key before investing. Not all will succeed
Over the short term, these companies are in a downtrend. So the expectation is that they will keep going lower, especially with inflation and the Fed's hikes and QT expectations.

Most hedge funds and traders are not adding here and will wait until a trend reversal.
Read 5 tweets
Mar 19, 2022
Winners keep on winning.

Here we evaluate 40 of the biggest winners in the market in the past decade.

They were able to compound between 14% and 67% CAGR for 5+ years and are currently valued on average at NTM 31x P/E and 40x FCF.
These are special companies, that have stood the test of time and delivered high returns to shareholders.

One of the main characteristics that most of these companies have in common is achieving high return on capital:
Most of these companies have achieved over 15% ROIC on average each year. And there are some that consistently sustain 20% ROIC, which is outstanding.

They belong to different industries:
Semis
Retail
E-Commerce
Railroads
SaaS
Railroads
Financials Markets
Industrials
Etc
Read 13 tweets
Mar 14, 2022
After Q4 earnings reports and recent volatility, we take a look at different valuation multiples of technology companies.

Many are profitable on a free cash flow basis, so first we compare EV/FCF LTM vs 3-yr Revenue Growth estimates:
Based on the business characteristics and financials, sometimes valuations between free cash flow multiples and EBITDA multiples vary widely.

In this chart, we compare EV/EBITDA NTM vs 3 year Revenue Growth estimates:
Finally, to be able to compare all companies - profitable and unprofitable - we use here EV/GP NTM vs 3-yr Revenue Growth estimates.

This may not be ideal in the current environment, but it is still a better approach than basic P/S multiples.
Read 11 tweets

Did Thread Reader help you today?

Support us! We are indie developers!


This site is made by just two indie developers on a laptop doing marketing, support and development! Read more about the story.

Become a Premium Member ($3/month or $30/year) and get exclusive features!

Become Premium

Don't want to be a Premium member but still want to support us?

Make a small donation by buying us coffee ($5) or help with server cost ($10)

Donate via Paypal

Or Donate anonymously using crypto!

Ethereum

0xfe58350B80634f60Fa6Dc149a72b4DFbc17D341E copy

Bitcoin

3ATGMxNzCUFzxpMCHL5sWSt4DVtS8UqXpi copy

Thank you for your support!

Follow Us!

:(