
𝗟𝗲𝘁'𝘀 𝗯𝗲 𝗵𝗼𝗻𝗲𝘀𝘁: generally, debugging is not a fun task 🤢
Especially for serverless, event-driven & distributed systems.
From Lambda's logging basics to 𝘀𝗮𝘃𝗶𝗻𝗴 𝘁𝗶𝗺𝗲 & 𝗻𝗲𝗿𝘃𝗲𝘀 ↓
Especially for serverless, event-driven & distributed systems.
From Lambda's logging basics to 𝘀𝗮𝘃𝗶𝗻𝗴 𝘁𝗶𝗺𝗲 & 𝗻𝗲𝗿𝘃𝗲𝘀 ↓
Lambda's a serverless technology provided by AWS.
But that 𝗱𝗼𝗲𝘀𝗻'𝘁 𝗺𝗲𝗮𝗻 that there are no servers.
In the background, there are countless micro-containers running on top of the traditional servers.
Where do all the logs of those containers go to?
But that 𝗱𝗼𝗲𝘀𝗻'𝘁 𝗺𝗲𝗮𝗻 that there are no servers.
In the background, there are countless micro-containers running on top of the traditional servers.
Where do all the logs of those containers go to?
By default, they will end up in CloudWatch.
Every Lambda will receive its own 𝗹𝗼𝗴 𝗴𝗿𝗼𝘂𝗽.
Like a repository for logs.
Not only that, every micro-container will create a new so-called 𝗹𝗼𝗴 𝘀𝘁𝗿𝗲𝗮𝗺.
Think of it as a text file where logs are written to.
Every Lambda will receive its own 𝗹𝗼𝗴 𝗴𝗿𝗼𝘂𝗽.
Like a repository for logs.
Not only that, every micro-container will create a new so-called 𝗹𝗼𝗴 𝘀𝘁𝗿𝗲𝗮𝗺.
Think of it as a text file where logs are written to.
As a micro-container can live several minutes and also serve dozens of requests in that live-time, there can be countless logs in a single stream.
If there are parallel requests, we're even having multiple log streams written in parallel!
If there are parallel requests, we're even having multiple log streams written in parallel!
𝗧𝗵𝗲 𝗖𝗵𝗮𝗹𝗹𝗲𝗻𝗴𝗲 𝘄𝗶𝘁𝗵 𝗗𝗲𝗯𝘂𝗴𝗴𝗶𝗻𝗴
You already see the problem: finding corresponding logs to your request in CloudWatch is cumbersome.
Even if you know the time window for your failed request, you need to browse all log streams.
You already see the problem: finding corresponding logs to your request in CloudWatch is cumbersome.
Even if you know the time window for your failed request, you need to browse all log streams.
Maybe the target log stream was created way before the failed request and contains endless other unrelated logs.
In addition, CloudWatch Console Interface is not very user-friendly. You can just load a short period of logs - scrolling up or down will load another small batch.
In addition, CloudWatch Console Interface is not very user-friendly. You can just load a short period of logs - scrolling up or down will load another small batch.
Before even starting to address the issue, you've maybe already spent 30 minutes.
So what's the solution?
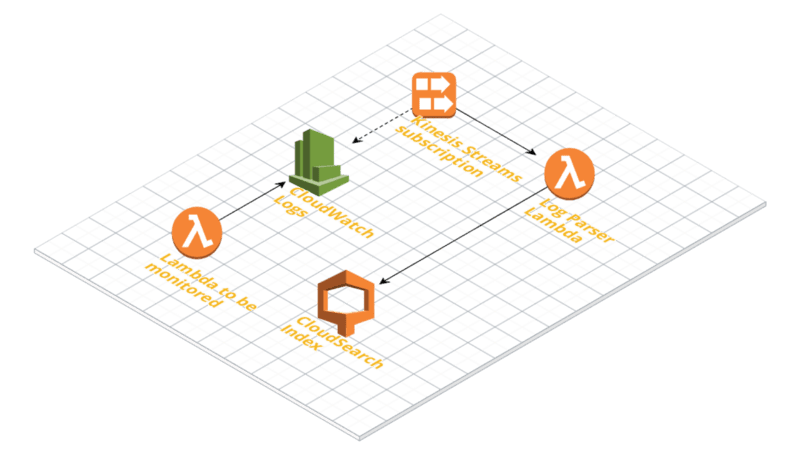
We can make use of the 𝗦𝗧𝗔𝗥𝗧/𝗘𝗡𝗗 logs containing a dedicated request identifier (per invocation) and set up 𝗟𝗼𝗴 𝗚𝗿𝗼𝘂𝗽 𝗦𝘂𝗯𝘀𝗰𝗿𝗶𝗽𝘁𝗶𝗼𝗻𝘀.
So what's the solution?
We can make use of the 𝗦𝗧𝗔𝗥𝗧/𝗘𝗡𝗗 logs containing a dedicated request identifier (per invocation) and set up 𝗟𝗼𝗴 𝗚𝗿𝗼𝘂𝗽 𝗦𝘂𝗯𝘀𝗰𝗿𝗶𝗽𝘁𝗶𝗼𝗻𝘀.
By subscribing 𝗞𝗶𝗻𝗲𝘀𝗶𝘀 to our log groups and configuring a Log Parser we'll get the logs and break them up into invocations
Finally, each piece of log related to one invocation can be saved individually in a database (such as CloudSearch) for later search and debugging.
Finally, each piece of log related to one invocation can be saved individually in a database (such as CloudSearch) for later search and debugging.
You can build this yourself & try out other options like @thedashbird, where you get it out of the box 🎁
Biased, as I'm dashbird's dev-🥑 & I'm using it for my own SaaS 👀
Also in the box:
• well-architected hints
• alerting (e.g. slack)
• security warnings
... & more 👋
Biased, as I'm dashbird's dev-🥑 & I'm using it for my own SaaS 👀
Also in the box:
• well-architected hints
• alerting (e.g. slack)
• security warnings
... & more 👋
• • •
Missing some Tweet in this thread? You can try to
force a refresh


