Jurrien Timmer Profile picture
Oct 26, 2021 6 tweets 2 min read Read on X
With the Fed's taper imminent, rates were on the move again last week, both in nominal and real terms. The TIPS break-even spread continues to test its upper bound of the past five years or so. Are inflation expectations ready to break out? (THREAD) Image
TIPS break-evens have rebounded from the depths of the pandemic. History shows a tendency to mean-revert around 2%, with the top of the range around 2.3% in recent years. But further back, break-evens spent a fair amount of time near 3%. /2 Image
Given that the CPI is north of 5%, a breakout to 3% would not surprise me. /3
If inflation expectations do accelerate from here, it could very well happen without an acceleration in growth. That may stoke some fears of stagflation. You can see in the chart below that inflation breaks are clearly diverging from economic momentum. /4 Image
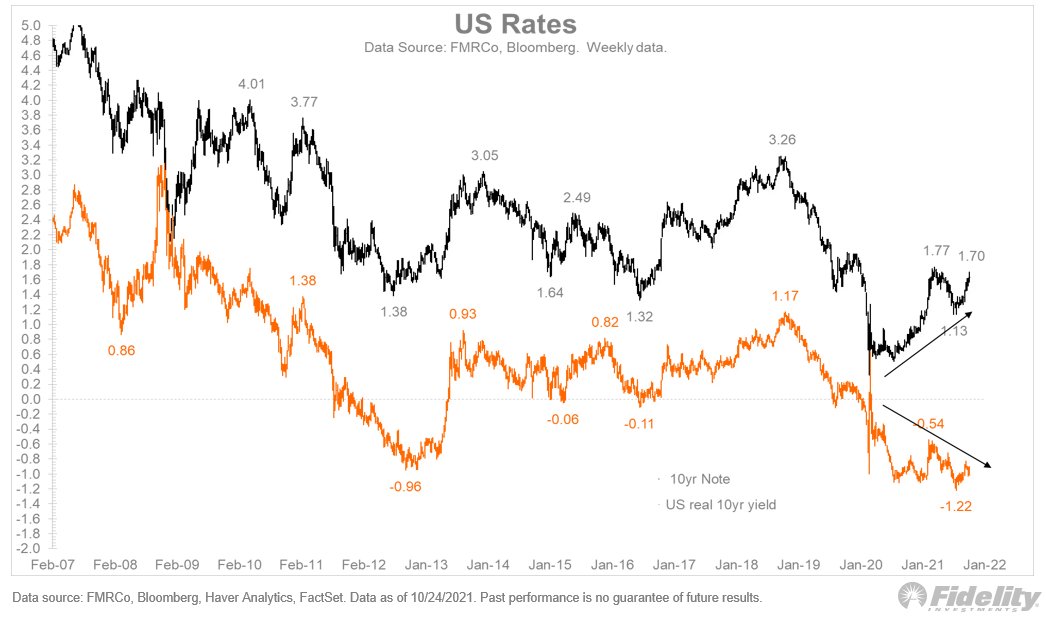
It’s interesting that both nominal yields and TIPS break-evens are rallying here, leaving real rates firmly in negative territory. /5 Image
This final chart highlights the divergence between nominal and real rates. One would be forgiven for expecting real rates to be above zero, considering where we are in the market cycle. /END Image

• • •

Missing some Tweet in this thread? You can try to force a refresh
 

Keep Current with Jurrien Timmer

Jurrien Timmer Profile picture

Stay in touch and get notified when new unrolls are available from this author!

Read all threads

This Thread may be Removed Anytime!

PDF

Twitter may remove this content at anytime! Save it as PDF for later use!

Try unrolling a thread yourself!

how to unroll video
  1. Follow @ThreadReaderApp to mention us!

  2. From a Twitter thread mention us with a keyword "unroll"
@threadreaderapp unroll

Practice here first or read more on our help page!

More from @TimmerFidelity

Sep 10
The narrative is clearly evolving from focusing on the inflation side of the Fed’s mandate to the growth side, and this comes at a time when the seasonals are reaching their weakest point and the mega growers continue to wobble.🧵 Image
The next easing cycle is only a week or so away, and the main question is whether the Fed goes with jumbo (50 bps) cuts or the garden variety 25 bps. /2 Image
No matter how you slice it, the Fed has plenty of room to cut rates here, with all iterations of the Taylor Rule heading south. /3 Image
Read 5 tweets
Jul 31
In absolute terms, the market is in decent shape, with 78% of stocks in uptrends. That’s higher than a few weeks ago, even though the index is lower.🧵 Image
The comparison to the narrow leadership of the late 1990’s is inevitable, but that cycle was much narrower than this one. This gives me some comfort that the current rotation doesn’t have to end in tears the way it did two decades ago. That was a bubble, but this one is not. /2
The two charts below are the same, except two and a half decades apart. Note how that final push to new highs in 2000 happened while 80% of stocks were in downtrends. Now that’s narrow! /3
Image
Image
Read 7 tweets
Jul 23
Put this in the “I thought I’d seen everything” department: the 13 week correlation between the S&P 500 cap-weighted index and the S&P 500 equal-weighted index is now 36%. That’s between two indices that have exactly the same constituents. It’s normally 99%, as one would expect🧵 Image
It’s a good illustration of just how bifurcated the market has become, and what can happen when that inevitable mean reversion finally kicks in. /2
So far, the rotation has been swift and has mostly happened at the expense of the headline indices, with the S&P 500 down 2.3% since the CPI release while the Russell 2000 is up 6.5%. It remains an open question as to whether the market can broaden and go up at the same time. /3 Image
Read 5 tweets
Jul 10
For the markets, it was more of the same last week: the winners won while the rest of the market spun its wheels. 🧵
This continues to be a tale of two markets, with the mega growers breaking away from the pack to such a degree that it becomes nearly impossible for the rest of the market to keep up, let alone outperform. It’s making me rethink the bullish broadening thesis. Perhaps the broadening can only happen in a down market, at least in relative terms. /2Image
In just the past three months the Mag 7 has rallied 23 percentage points more than the equal-weighted S&P 500 index. Year-to-date, the cap-weighted S&P 500 has gained 13 percentage points more than the equal-weighted index. If you think about the sheer magnitude of that spread, no wonder that so few stocks are outperforming. The bar is set impossibly high. /3Image
Read 4 tweets
Jun 28
With the debt dynamic worsening around the world, and central banks no longer funding that debt (at least for now), the direction of the term premium for bonds remains a question mark. With the correlation between stocks and bonds now positive, what role do bonds play in a diversified portfolio? 🧵
There are certainly reasons to own them: real yields are now positive and the math of owning bonds is far better now than it was a few years ago. But since 2022 they have not provided the relative balance that the 60/40 paradigm had generally provided since the late 1990’s. /2
If we look at the distribution of risk (annualized volatility) and return, we see that a 60/40 index (60% S&P 500, 40% Bloomberg Agg.) appears to have delivered the goods from 1950 through 2024.. A 9% CAGR against a 9% vol is nothing to complain about. /3 Image
Read 8 tweets
Jun 27
We are now in an era of fiscal dominance, with deficits running at 7% of GDP with no end in sight. The US is now spending more than a trillion dollars on debt service, and projections from the Congressional Budget Office (CBO) give little reason to expect this to improve. The big question is what role the Fed will play in this new regime.🧵Image
For now, the Fed is on the other side of fiscal policy, keeping monetary policy restrictive while fiscal policy is loose. Debt levels are high, although relative to GDP they are below the 2020 extreme. /2 Image
This divergence between fiscal and monetary policy may be what is keeping the dollar bid these days. The dollar’s strength has persisted despite the USD gradually losing its some of its dominance as the world’s leading reserve currency. /3 Image
Read 6 tweets

Did Thread Reader help you today?

Support us! We are indie developers!


This site is made by just two indie developers on a laptop doing marketing, support and development! Read more about the story.

Become a Premium Member ($3/month or $30/year) and get exclusive features!

Become Premium

Don't want to be a Premium member but still want to support us?

Make a small donation by buying us coffee ($5) or help with server cost ($10)

Donate via Paypal

Or Donate anonymously using crypto!

Ethereum

0xfe58350B80634f60Fa6Dc149a72b4DFbc17D341E copy

Bitcoin

3ATGMxNzCUFzxpMCHL5sWSt4DVtS8UqXpi copy

Thank you for your support!

Follow Us!

:(