Scotland: 2021 mortality through week 42 (NRS)
1/ Overall
Again a very high week, +252 from the 5 year average, which is 24% excess. Now 22 consecutive weeks of excess mortality, but also where i) it’s summer, and ii) the trend is still elevating.
(2020 included for reference)
1/ Overall
Again a very high week, +252 from the 5 year average, which is 24% excess. Now 22 consecutive weeks of excess mortality, but also where i) it’s summer, and ii) the trend is still elevating.
(2020 included for reference)

1b/ Overall
For context this shows ‘winter mortality’ (weeks 27-42) of each of the last 30 years, ranked. This year 2021-22 is the worst position we’ve seen up until this time of year.
For context this shows ‘winter mortality’ (weeks 27-42) of each of the last 30 years, ranked. This year 2021-22 is the worst position we’ve seen up until this time of year.

1c/ Overall
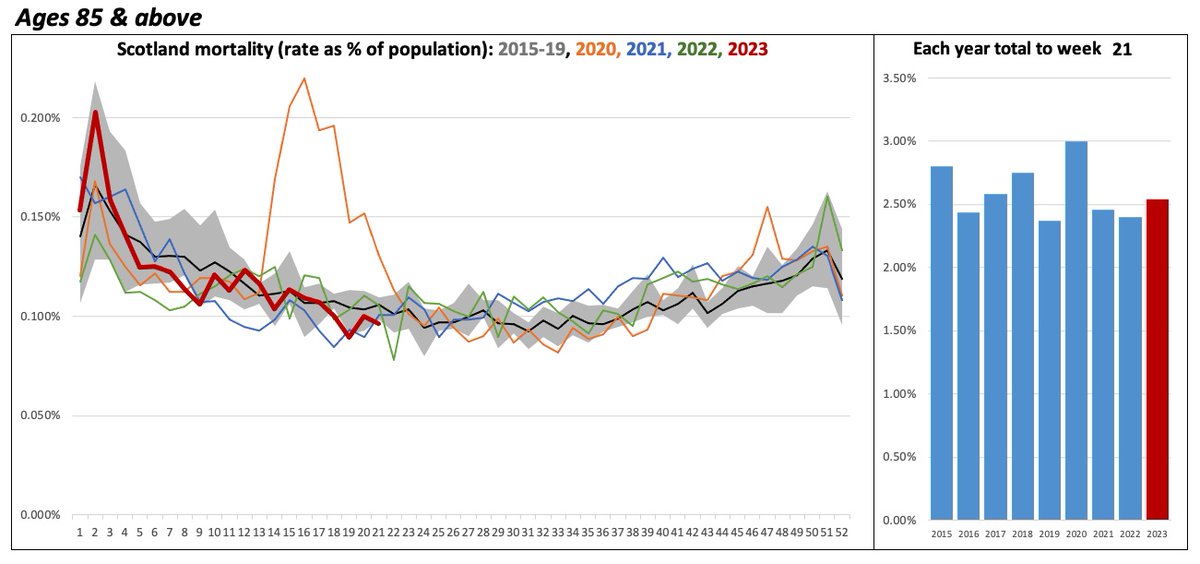
Another way to view, is annualising the weekly numbers - this would normally rise into winter, then settle down, with between 0.99% and 1.19% sadly passing away each year.
This 2021-22 period through week 42 is highest, & trending away from the others (getting worse)
Another way to view, is annualising the weekly numbers - this would normally rise into winter, then settle down, with between 0.99% and 1.19% sadly passing away each year.
This 2021-22 period through week 42 is highest, & trending away from the others (getting worse)

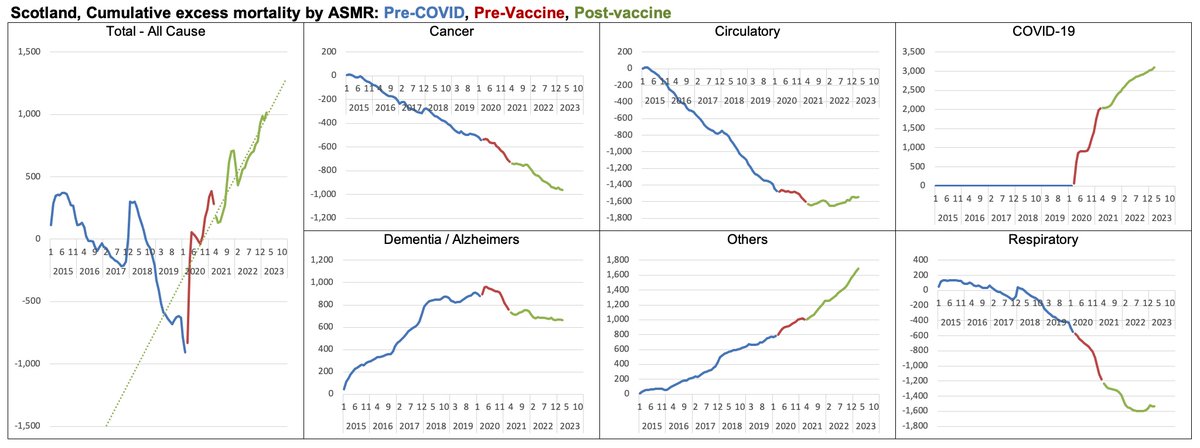
2/ Excess mortality by cause (covid / non-covid)
Covid (‘death for any reason within 28 days of a positive test’) making up slightly less than half of the excess.
All covid deaths are classed as excess.
Covid (‘death for any reason within 28 days of a positive test’) making up slightly less than half of the excess.
All covid deaths are classed as excess.

3/ Excess mortality by location of death
Excess mortality at home continues to make up the majority, as has been the case through the year, but excess mortality at hospital continues to trend up.
Small excess at care homes.
Excess mortality at home continues to make up the majority, as has been the case through the year, but excess mortality at hospital continues to trend up.
Small excess at care homes.

4a/ Total mortality by age
Here the trend of ‘higher excess by higher age’ is maintained, seeing a rising gap in 45-64, deviating farther from the 5 year average
Here the trend of ‘higher excess by higher age’ is maintained, seeing a rising gap in 45-64, deviating farther from the 5 year average

4b/ Cumulative summer excess, by age group
Here the ‘staged’ growth of excess mortality is maintained, all growing. Growth slightly less rapid in the most elderly (?), but 65-74 and 45-64 sadly trending up.
Here the ‘staged’ growth of excess mortality is maintained, all growing. Growth slightly less rapid in the most elderly (?), but 65-74 and 45-64 sadly trending up.

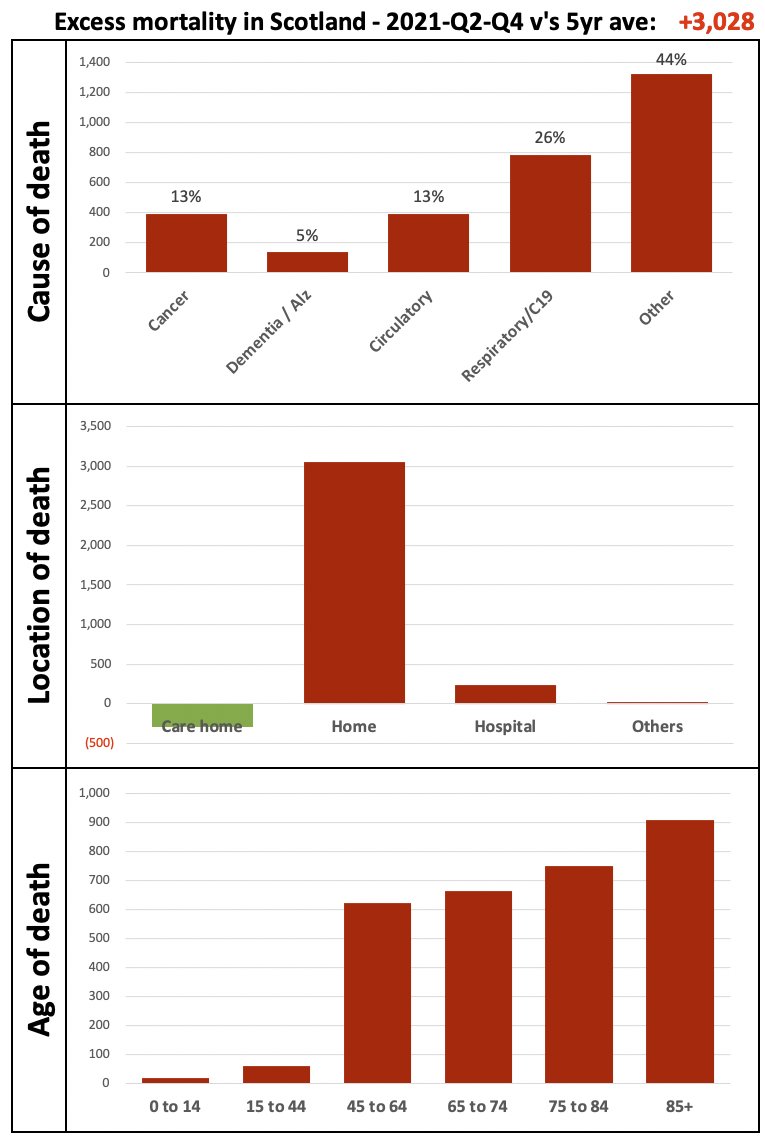
5/ Excess mortality through summer
Put those together and we can see the pattern of excess
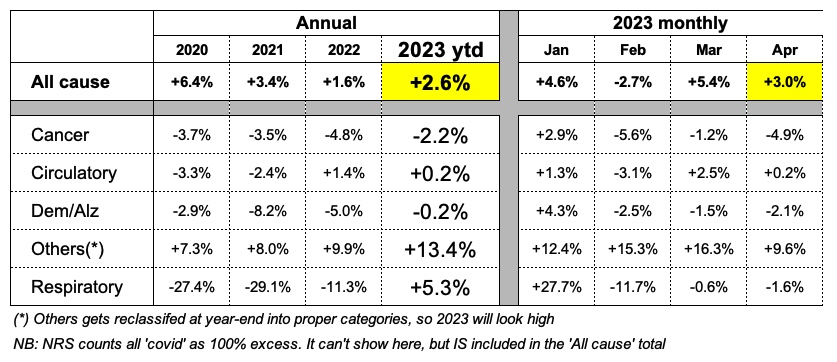
- Predominantly Others, almost half. Then respiratory, cancer, circulatory
- Non-respiratory (i.e. non-covid) is 74% of the excess
- Occurring at home
- The higher the age, higher excess.
Put those together and we can see the pattern of excess
- Predominantly Others, almost half. Then respiratory, cancer, circulatory
- Non-respiratory (i.e. non-covid) is 74% of the excess
- Occurring at home
- The higher the age, higher excess.
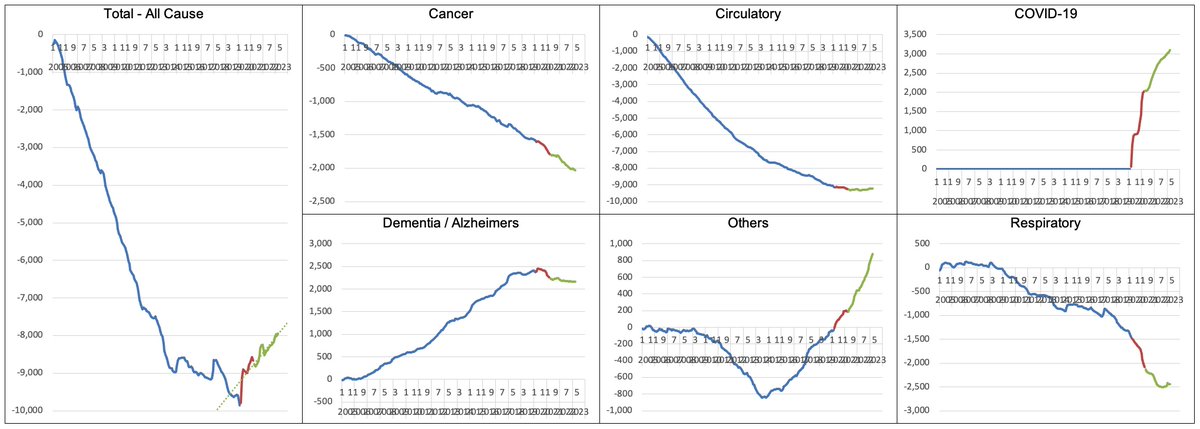
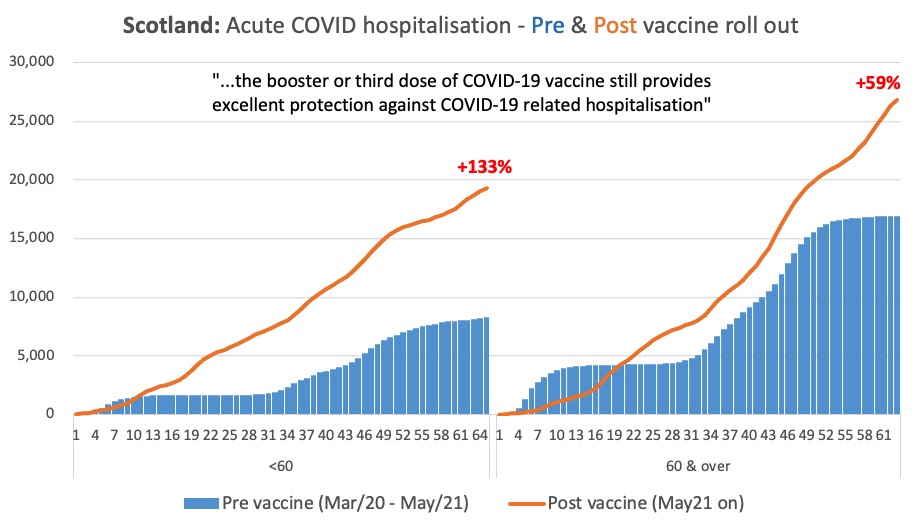
6/ Total mortality trends versus vaccination, by age

7a/ Child mortality (<1)
Trending a little high, but (a) settling down, and (b) birth rate has been higher, so naturally this may be higher also. As ‘events / births’ the numebr is a bit high, but in the range of what has been seen in the recent past (as 2016)
Trending a little high, but (a) settling down, and (b) birth rate has been higher, so naturally this may be higher also. As ‘events / births’ the numebr is a bit high, but in the range of what has been seen in the recent past (as 2016)

7b/ Child mortality (1-14)
Continues normal (and continues to show SARS-CoV-2 as being no mortal risk to children)
Continues normal (and continues to show SARS-CoV-2 as being no mortal risk to children)

8/ Mortality change versus 2020, by region
Comparing by different ways to see if any breakdown in the trends, but the upward trends seen do vary in scale across regions, but the direction and consistency is similar
Comparing by different ways to see if any breakdown in the trends, but the upward trends seen do vary in scale across regions, but the direction and consistency is similar

9a/ Summer excess
Looking at the same periods of 2021 and 2020 versus the five year average, we see the huge difference.
2020 was quite normal, +1.4% from the 5 year average. Meanwhile in summer 2021 we are 3,000 deaths higher than the 5 year, 15% above normal.
Looking at the same periods of 2021 and 2020 versus the five year average, we see the huge difference.
2020 was quite normal, +1.4% from the 5 year average. Meanwhile in summer 2021 we are 3,000 deaths higher than the 5 year, 15% above normal.

9b/ Summer excess
In context, the below shows how much each summer (weeks 23-42) deviated from the 5 year average. The maximum is 3% - here we see *15%*.
Such a deviation is quite extraordinary.
In context, the below shows how much each summer (weeks 23-42) deviated from the 5 year average. The maximum is 3% - here we see *15%*.
Such a deviation is quite extraordinary.

9c/ Summer excess
We may hold that it is 'caused by covid’, which may be the case. But in holding to that thesis we need to know (a) what made everything covid so much worse than last year?, and (b) respiratory excess is only 26% of our excess mortality. 74% has another reason.
We may hold that it is 'caused by covid’, which may be the case. But in holding to that thesis we need to know (a) what made everything covid so much worse than last year?, and (b) respiratory excess is only 26% of our excess mortality. 74% has another reason.

• • •
Missing some Tweet in this thread? You can try to
force a refresh