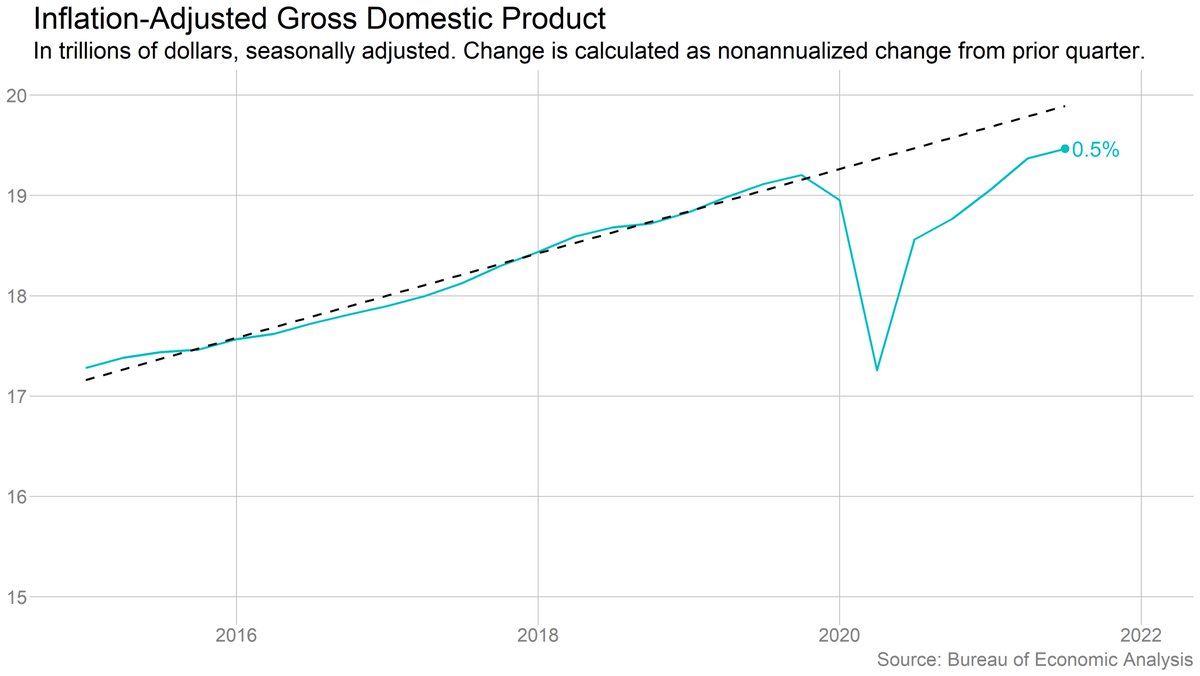
Economic output grew 0.5% in the third quarter (2% annualized). That's a sharp slowdown from the 1.6% (6.7% annualized) in Q2, as supply chain woes and the rise of the Delta variant constrained growth. nytimes.com/live/2021/10/2…
U.S. GDP surpassed its prepandemic level in the second quarter, but it's still well below the prepandemic trend.
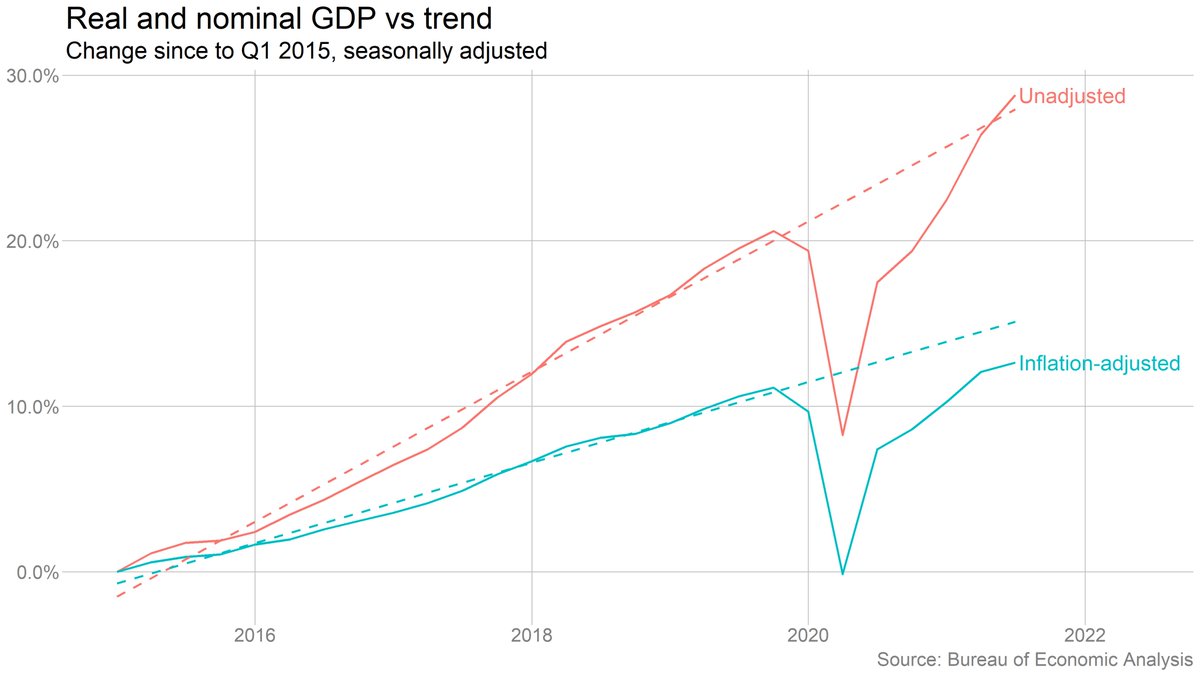
But inflation is a big part of the story here. Nominal (non-inflation-adjusted) GDP is back on its prepandemic trend. But real (inflation-adjusted) GDP is below. Fits with the story of demand outstripping supply, so some of it ends up as higher prices, not more production.
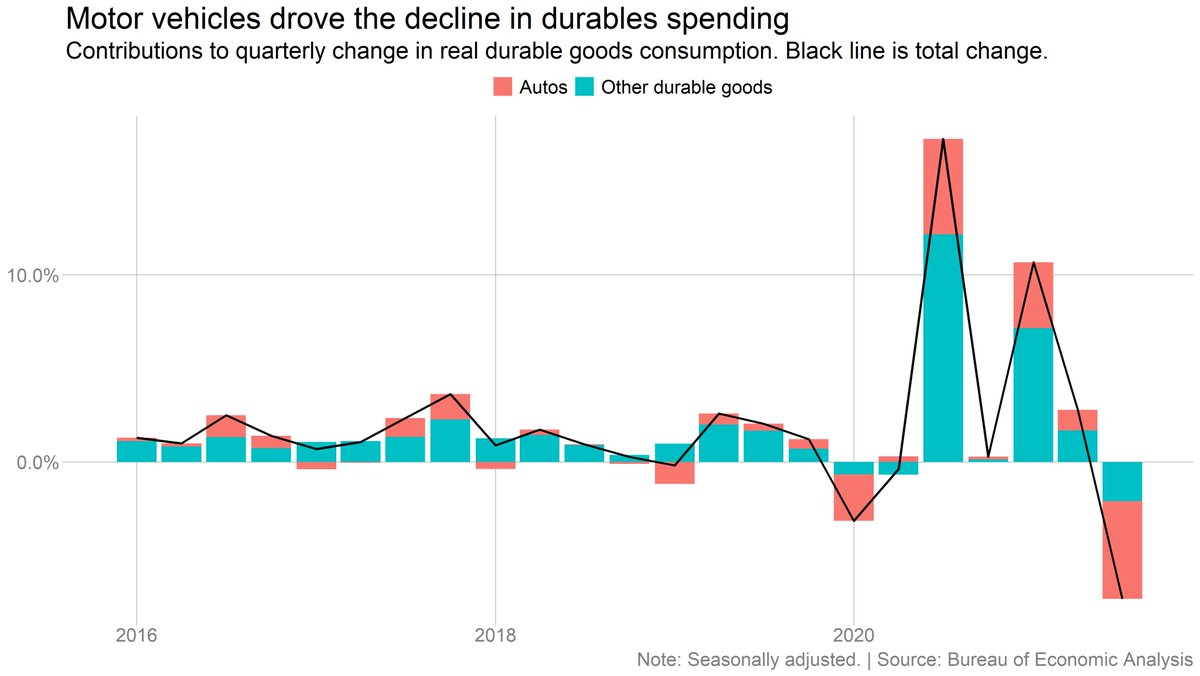
Supply chain snarls played a big role in the Q3 slowdown. Spending on durable goods fell 7%, with autos making up a huge part of the decline. nytimes.com/live/2021/10/2…
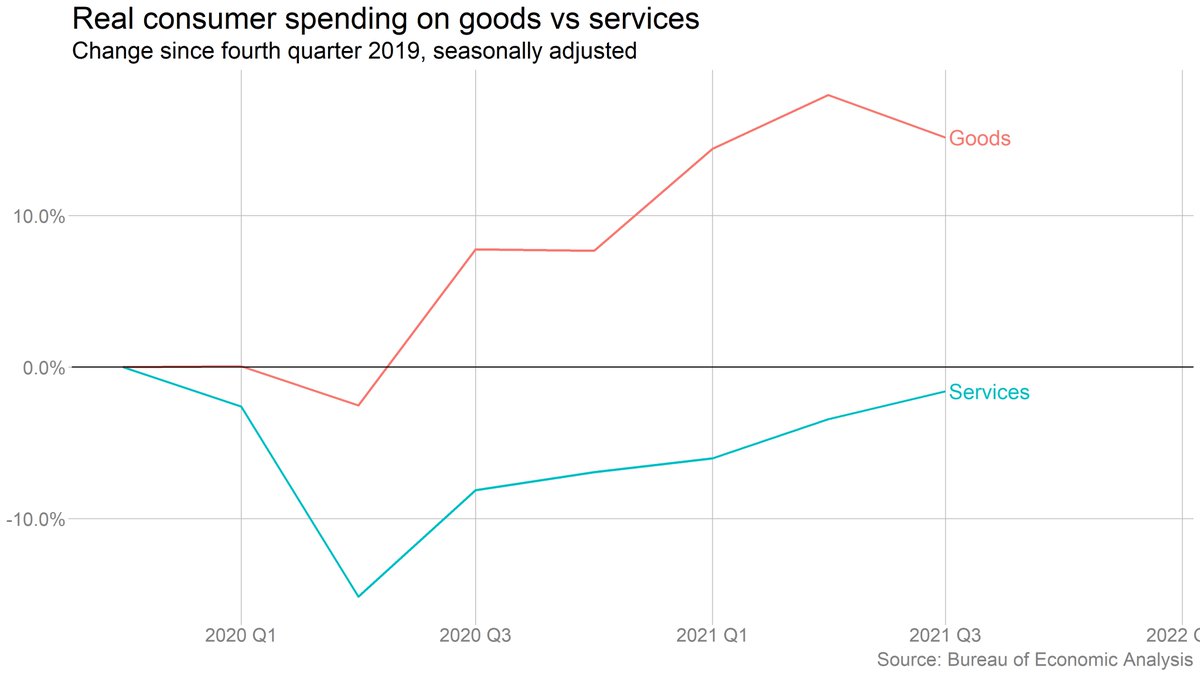
Services spending rose, but more slowly. Spending at hotels and restaurants had been helping to drive the rebound in services spending, but momentum slowed in Q3 because of Delta.
But the big picture is important here. Spending on goods is still way above its pre-Covid level and falling only gradually. Services spending is rising, but still below where it was before the pandemic. And all of that goods spending is contributing to the supply-chain issues.
• • •
Missing some Tweet in this thread? You can try to
force a refresh
OK, so I imagine everyone has moved on from this by now, but since I finally have a few minutes, I thought I'd do a quick thread explaining this, since it is FAR from intuitive.
The question @TheStalwart is asking here is very reasonable. If year-over-year inflation is calculated by measuring the price level in November 2025 and comparing it to the price level in November 2024, then nothing that happens in the middle should matter.
But with shelter (and to some degree with other things, but I'm going to stick with shelter here), we *don't* actually calculate inflation that way. At least not really.
It's #jobsday! Except it isn't, because of the government shutdown. Which means that we're left sifting through alternative data sources to try to figure out what's going on in the labor market.
So, what are those sources telling us? A 🧵:
Start with job growth: Measures from ADP, Revelio, LinkedIn, etc., all tell subtly different stories, but they mostly agree on the big picture. After slowing dramatically over the summer, private-sector job growth has remained weak, but it hasn't necessarily slowed much further.
A few quick #JOLTS 📈:
Starting with: Job openings are way down from their peak, but they've fallen slowly if at all in recent months. No obvious sign that labor demand is falling off a cliff.
But it IS getting harder to find a job. There is now less than one job opening per unemployed worker. Not a low rate by historical standards, but definitely weaker than just before the pandemic (and way weaker than at the peak of the reopening boom).
The hiring rate (gross hiring, not the net job change we measure in the Friday jobs reports) has been below its long-run average for more than a year. It had seemed like it was leveling off, but might be falling again now, though hard to say definitively just yet.
President Trump didn't like the jobs numbers, so he fired the person responsible for producing them.
It's a move that has been tried before, by leaders of countries from Argentina to Greece to the Soviet Union. It rarely ends well.
(Link at end of thread)
Janet Yellen, not a person prone to hyperbole, put it this way: “This is the kind of thing you would only expect to see in a banana republic."
Key point from Andreas Georgiou, who was criminally prosecuted for insisting on reporting accurate deficit figures when he was head of Greece's statistical agency: Reliable data is essential for democracy.
CBO is out with its final cost estimate of the tax-and-spending bill passed by the House.
- Revenue ⬇️ by $3.7 trillion over 10 years
- Spending ⬇️ by $1.3 trillion
- Debt ⬆️ by $2.4 trillion over 10 years
- Uninsured pop. ⬆️ by 10.9 million in 2034
Full analysis: cbo.gov/publication/61…
The spending cuts mostly come from Medicaid ($344 billion over 10 years), food stamps and related programs ($295 billion) and the Affordable Care Act ($132 billion).
Note that these estimates don't take into account the macroeconomic impacts of the policy changes (it is not "dynamic" in wonk parlance). So to the extent tax/spending cuts affect economic growth, that will also affect revenues. CBO is working on an analysis that estimates these effects.
So this was an interesting finding from @NateSilver538, but one I found odd because @BLS_gov publishes CPI for regions (and for some metro areas) but not for states. So I dug into it a bit, and there's less here than meets the eye.
Nate's data is coming from this tracker from the @JECRepublicans. They don't have a state-level inflation estimate either, though. They just use BLS's estimate of regional inflation and apply it to an estimate of household spending when Biden took office. jec.senate.gov/public/index.c…
You can see this if you hover over their map (or download their data). States in the same region all have the same cumulative rates of inflation. But they differ in the amount of inflation experienced in dollar terms because some states have higher avg household incomes.