Income/spending/inflation data for September:
Personal income (nominal): -1%
Consumer spending (nominal): +0.6%
Consumer prices: +0.3% m/m, +4.4% y/y
Core consumer prices: +0.2% m/m, +3.6% y/y
bea.gov/news/2021/pers…
Personal income (nominal): -1%
Consumer spending (nominal): +0.6%
Consumer prices: +0.3% m/m, +4.4% y/y
Core consumer prices: +0.2% m/m, +3.6% y/y
bea.gov/news/2021/pers…
September Employment Cost Index, *three month* change:
Total compensation: +1.3% (vs 0.7% in June)
Wages and salaries: +1.5% (0.9% June)
Leisure & hosp. wages/salaries: +2.6% (2.8% June)
bls.gov/news.release/e…
Total compensation: +1.3% (vs 0.7% in June)
Wages and salaries: +1.5% (0.9% June)
Leisure & hosp. wages/salaries: +2.6% (2.8% June)
bls.gov/news.release/e…
The drop in income in September was driven by the end of expanded federal unemployment benefits. Wage and salary income actually rose faster in Sept. than in August. 

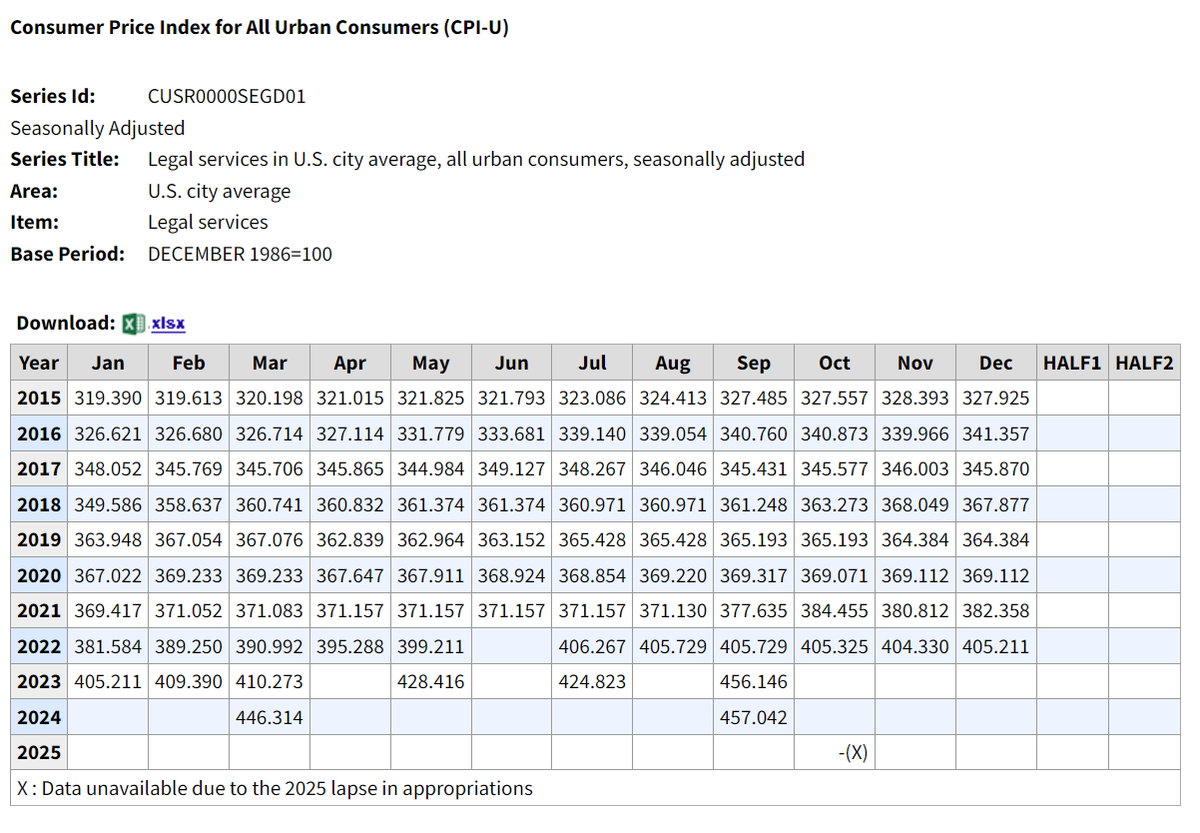
Overall consumer prices were up 4.4% from a year ago, the fastest rate of inflation since 1991. But the month-to-month rate of inflation has slowed significantly since the spring.


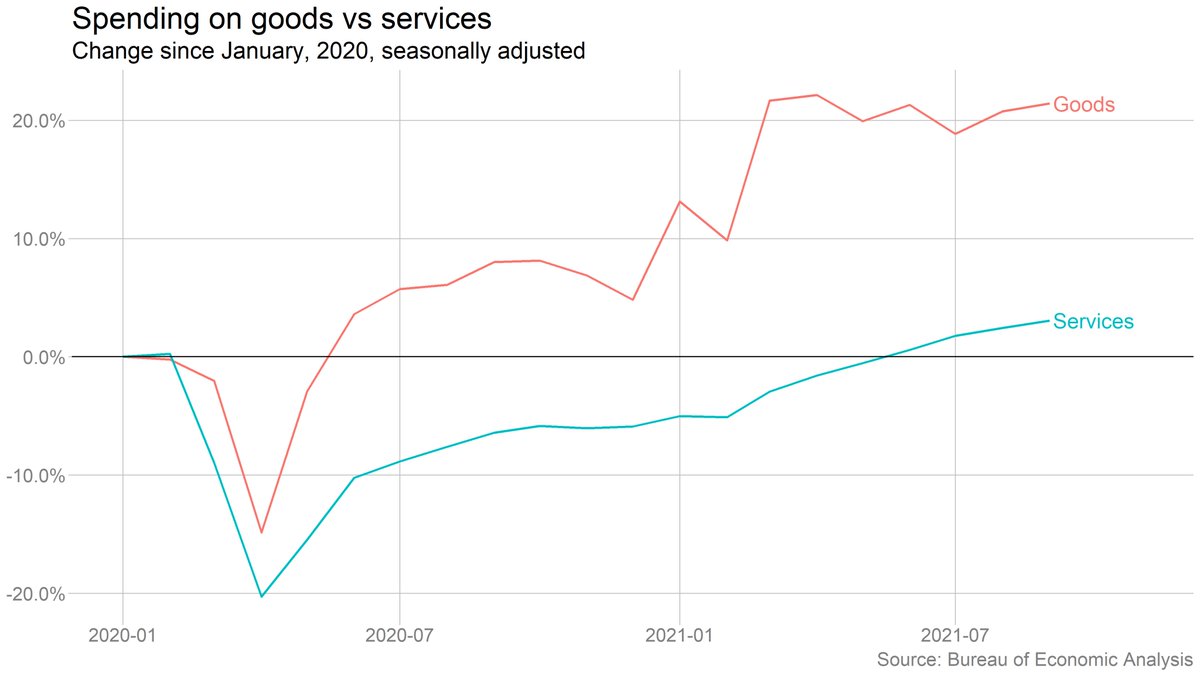
For all the talk of Delta's impact on the economy, overall services spending continued to rise through the summer and into fall. But the real story is in goods spending, which remains extraordinarily high (a big part of the reason for all the supply-chain issues).
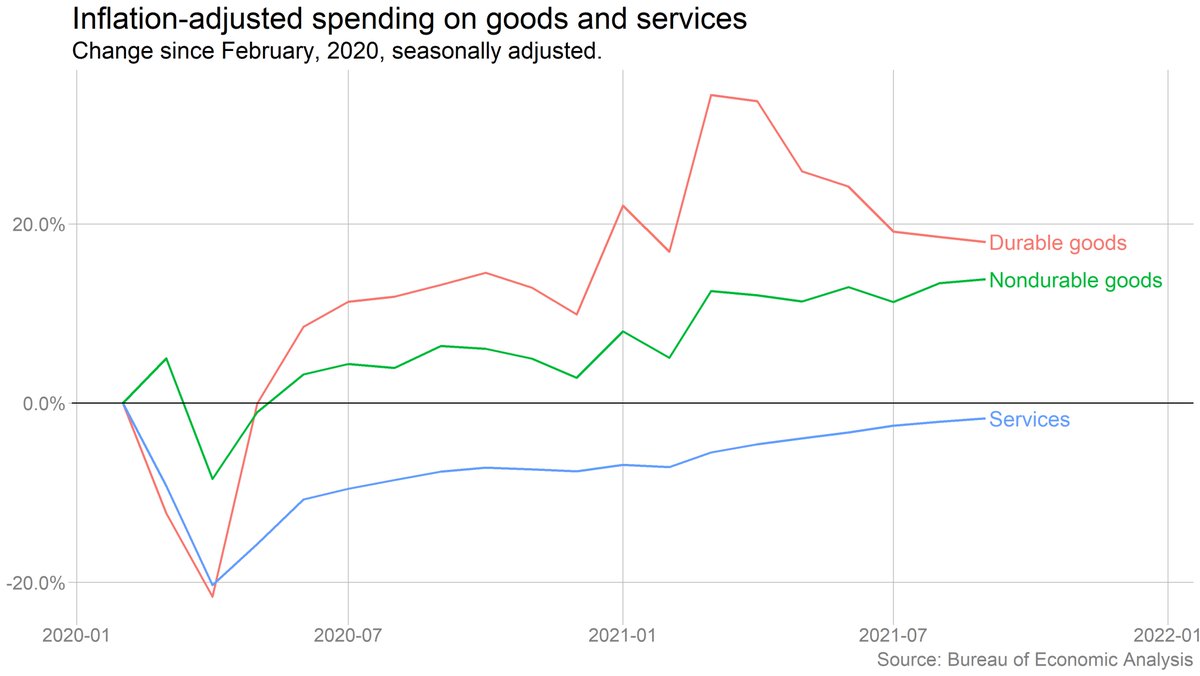
It's even clearer when we break up goods spending. Durables spending has been through the roof, and while it's eased off a bit some recently, it's still extremely elevated.

Of course, those are nominal spending figures, which means they're capturing price increases as well as volume increases. In real (inflation-adjusted) terms, durable-goods spending has fallen by more, and services spending is still below prepandemic levels.
Americans, collectively, still have a lot of cash to spend. Monthly savings rates have finally come down close to prepandemic levels, but that still means people haven't spent down accumulated savings.
Caveat, as always: These savings are VERY unequally distributed.
Caveat, as always: These savings are VERY unequally distributed.

To my earlier point about Delta: You can see its effects in a few select categories (air travel, hotels, movies). But other categories held up ok, and overall services spending kept rising.

OK, shifting over to the Employment Cost Index data. As a reminder, these numbers are a much better measure of wage growth than the better-known earnings data in the monthly jobs report, because ECI tries to adjust for compositional shifts.
Overall wages and salaries rose 1.5 percent from June-September, and were up 4.2% year-over-year. Total compensation (incl. benefits) was up 1.3% (3.7% y/y). That's a significant acceleration from the already big increases in June.

Unsurprisingly, wages are rising particularly fast in leisure and hospitality -- although wage growth there actually slowed slightly from June. (Still up 2.6% in just three months.)
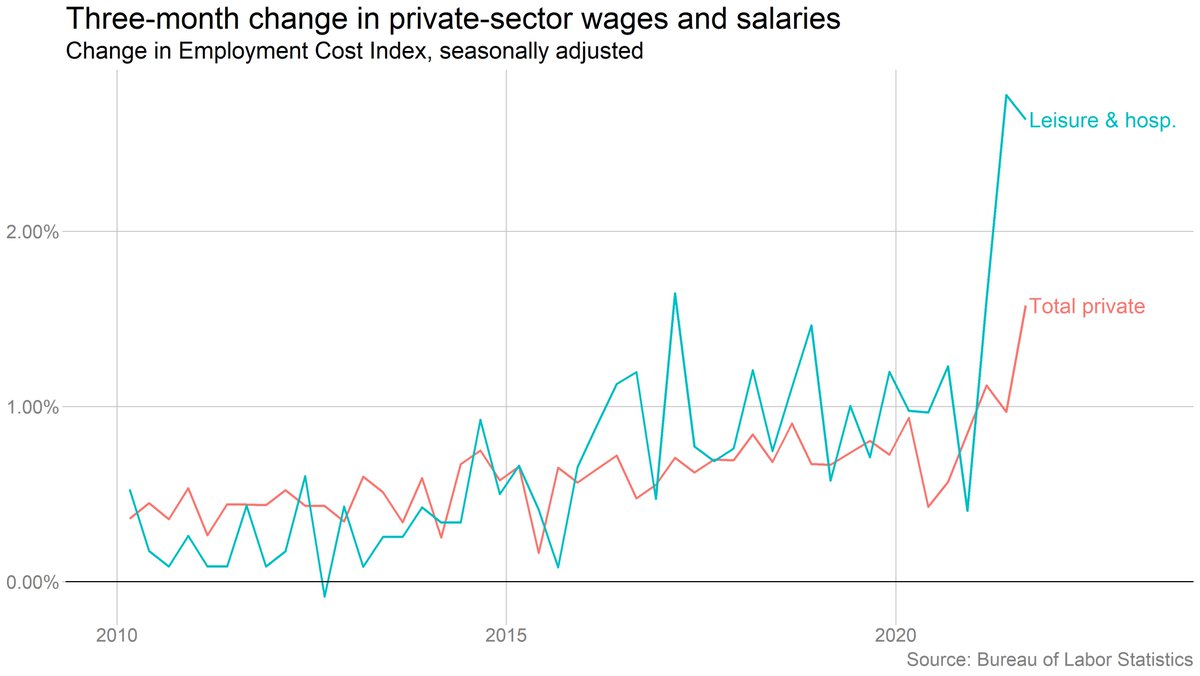
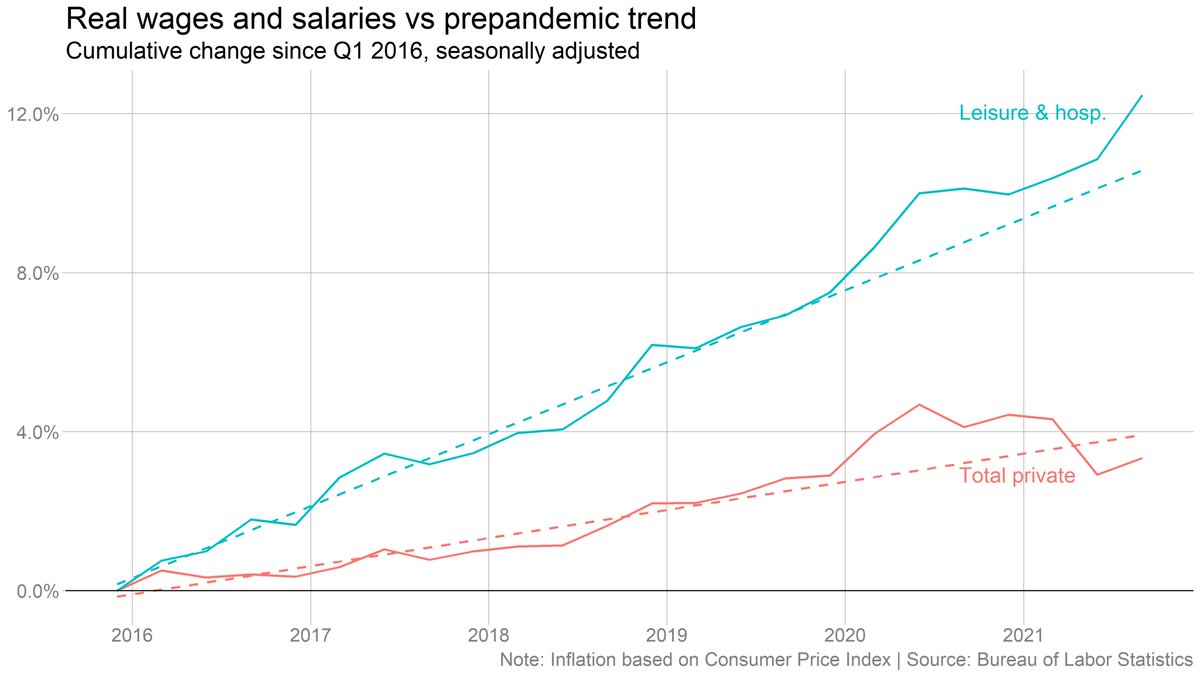
It's worth looking at wage growth vs its prepandemic trend path. For both the private sector as a whole and for leisure & hospitality in particular, the recent growth represents a clear acceleration, not just in growth rates but in absolute levels.

This looks very different if you adjust for inflation, however. Leisure and hospitality workers are seeing real gains against their prepandemic trend. But faster inflation means that workers as a whole are falling behind, despite substantial (nominal) wage gains.
• • •
Missing some Tweet in this thread? You can try to
force a refresh