Suomen epidemia 2.11.2021: tartuntojen kasvu kiihtyy. Testien määrä vähenee edelleen. Efektiivinen yli 80 prosentin rokotuskattavuus vähenee. Mutta 2. rokotusten määrä on ruvennut nousemaan, ja positiivisten osuus ei noussut tänään.
1/x
1/x

Tänään THL ilmoitti 807 tartuntaa, ei poistanut yhtään, ja otti viivettä kiinni 84 tartunnan verran. Muuttumattomalla viiveellä laskettu (eli sairaanhoitopiirien lukuihin perustuva) uusien tartuntojen määrä = 807+0-84 = 723 (punainen viiva).
2/x
2/x

Testien määrä vähenee edelleen. 18.10. jälkeen vauhti on ollut keskimäärin -1.24 prosenttia päivässä = -31 prosenttia kuukaudessa.
3/x
3/x

Positiivisten osuus ei noussut tänään. Tämä on hyvä uutinen. Tämä tieto kuitenkin tulee 5 päivän viivellä, ja tartuntojen määrä on tämän jälkeen kasvanut.
4/x
4/x

Rokotusten tahti on hieman piristynyt. Syynä on Länsi-Pohja, missä 2. rokotusten määrä on lähtenyt selvään nousuun.
5/x
5/x

Länsi-Pohjassa halukkuus hakea 2. rokotusta on selvästi noussut. Voi johtua nykyisestä epidemiasta tai sitten siitä, että rokotteita ja rokotusaikoja on tullut tarjolle.
6/x
6/x

Myös ensimmäistä rokotusta on ruvennut hakemaan enemmän Länsi-Pohjassa.
7/x
7/x
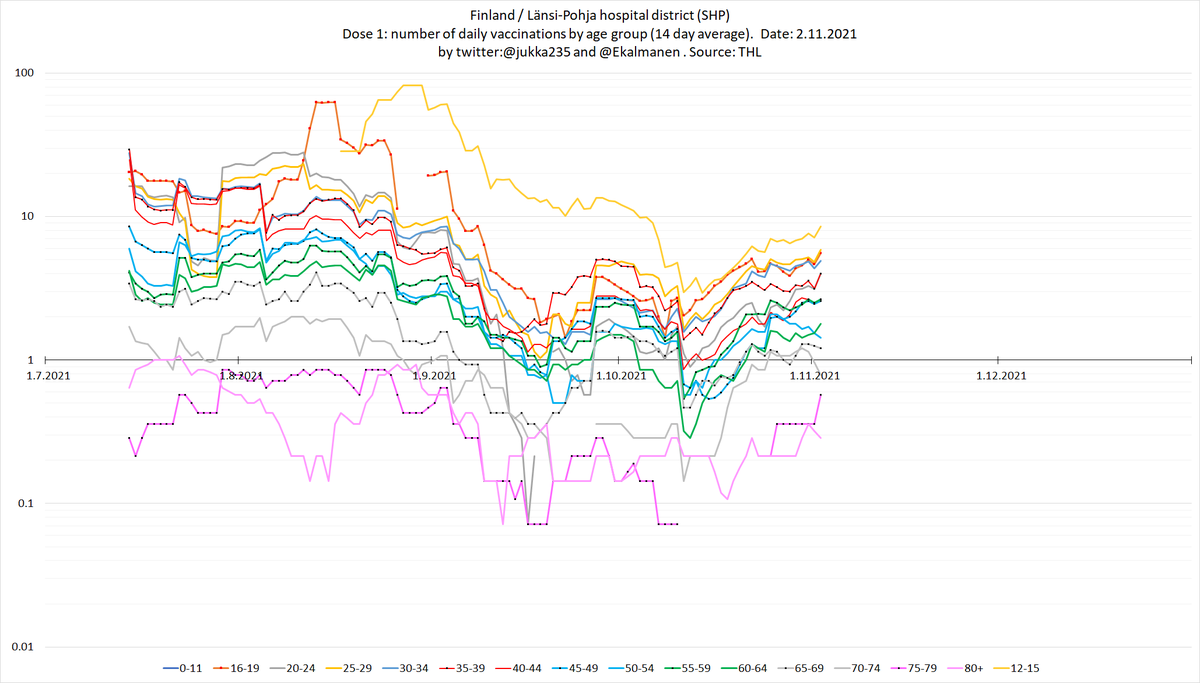
Tulos: Länsi-Pohjassa rokotusten määrä on noussut kestävälle tasolle, jolla saadaan 80% väestöstä rokotettua 6.5 kuukauden välein (keltainen viiva).
8/x
8/x

Toinen tulos: Länsi-Pohjassa efektiivinen yli 80 prosentin rokotuskattavuus on noussut uuteen ennätykseen. Tämä ottaa huomioon rokotteiden vanhenemisen.
9/x
9/x

Tässä yhteenveto rokotusten tilanteesta Suomessa. Rokotuskattavuus on ilmaistu rokotusten kykynä suojata vakavalta sairaudelta (eli sairaalaan joutumiselta). Rokottamattomien kerroin = 1.
10/x
10/x

Tässä on oletettu, että 2x rokotus antaa 10-kertaisen suojan vakavaa tautia vastaan. Jos 100 prosenttia väestöstä on rokotettu, kerroin on juuri tuo 10. Mutta jos vain puolet on rokotettu, niin kerroin on vain 1.8.
11/x
11/x

Tästä kuvasta näkyy hyvin, mikä vaikutus on rokotuskattavuuden nousulla. Ne viimeiset prosentit ovat ne kaikkein tärkeimmät. Lisäksi ilman alle 12-vuotiaiden rokottamista ei voida päästä kuin noin 45 prosenttiin siitä suojasta, jonka rokote voi antaa.
12/x
12/x

Deltan R on arvolta 6-8 jos se saa levitä vapaasti. R-lukua voidaan alentaa rokotuksin, erilaisin toimenpitein (maskit jne.) ja rajoituksin (esim. baarien sulkemiset). Jos näiden yhteinen suojausteho ei riitä, tartuntojen määrä kasvaa.
13/x
13/x

Suomen sairaanhoitopiirien efektiivinen >80% rokotuskattavuus on 52-60 prosentin välillä (2. rokotus). Sillä tasolla saadaan aikaan suojauskerroin 1.88-2.17. Jos ihmiset eivät ota rokotuksia, tarvitaan kovempia rajoituksia.
14/x
14/x

Ja tästä kuvasta selviää myös, mikä ero on nykyisellä (52-60), 70 ja 80 prosentin rokotuskattavuudella.
- 70% kattavuus antaa suojakertoimen 2.70 (33% enemmän kuin nyt)
- 80% kattavuus antaa kertoimen 3.57 (76% enemmän kuin nyt ja 32% enemmän kuin 70% kattavuus)
15/x
- 70% kattavuus antaa suojakertoimen 2.70 (33% enemmän kuin nyt)
- 80% kattavuus antaa kertoimen 3.57 (76% enemmän kuin nyt ja 32% enemmän kuin 70% kattavuus)
15/x
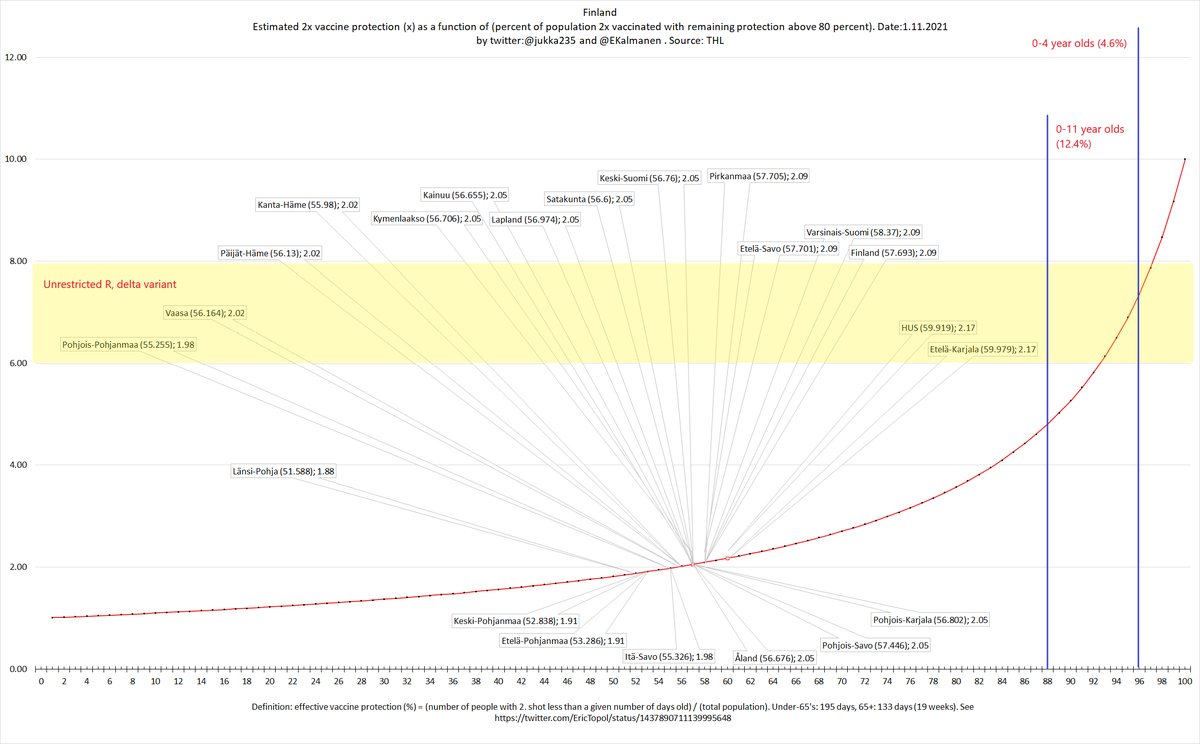
Mikä on best case?
- 90 prosenttia yli 12-vuotiaista rokotettu (=0.9x0.876=78.8% koko väestöstä)
- kaikki alle 12-vuotiaat rokotettu (12.4% koko väestöstä)
- yhteensä 91.2%, vastaa kerrointa 5.6
16/x
- 90 prosenttia yli 12-vuotiaista rokotettu (=0.9x0.876=78.8% koko väestöstä)
- kaikki alle 12-vuotiaat rokotettu (12.4% koko väestöstä)
- yhteensä 91.2%, vastaa kerrointa 5.6
16/x

Sairaanhoidon tarve on tähän mennessä kasvanut eksponentiaalisesti, eli on piirtänyt suoraa viivaa log asteikolla. Ainoa selvä poikkeus on KYS erityisvastuualue (Kuopio). KYS:n alueella tartuntojen ilmaantuvuus on laskenut selvästi.
17/x
17/x
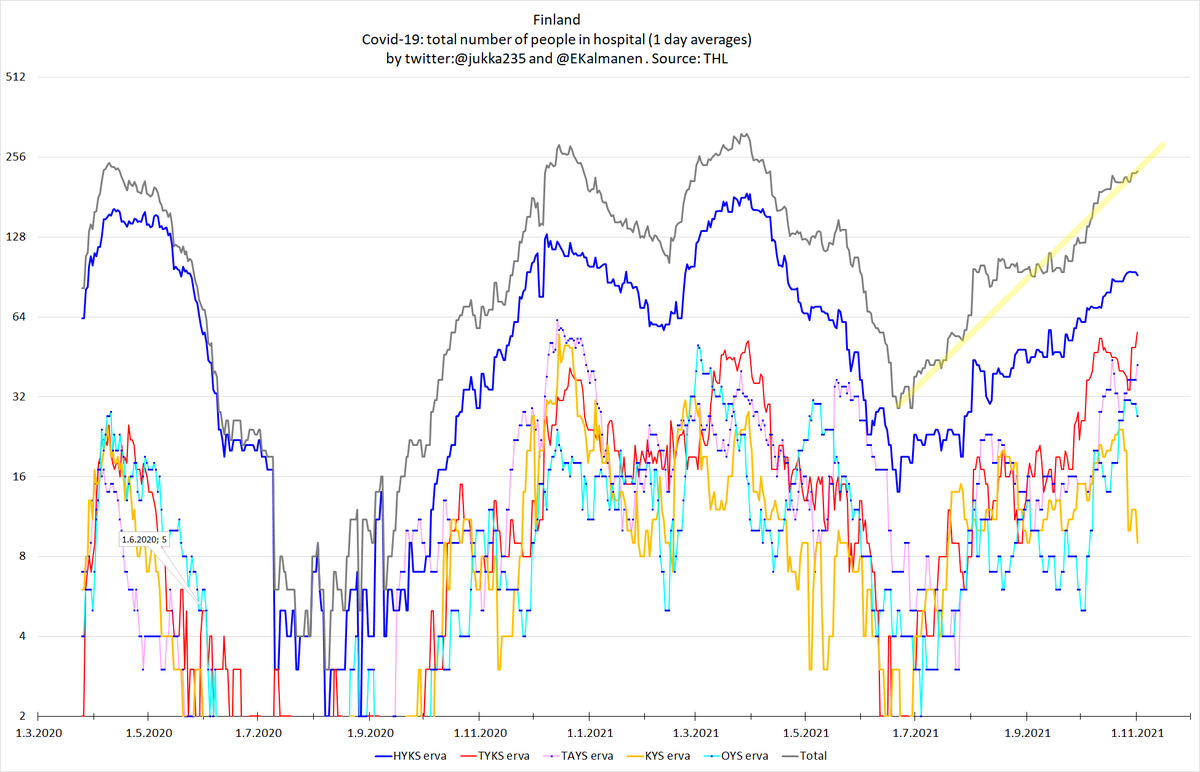
OYS erityisvastuualueen tartuntojen tilanne on huonoin koko epidemian aikana. Sairaanhoidon lukujen perusteella arvioitu todellinen tartuntojen määrä on noin 2-3 kertaa testeillä todettu määrä. Tämä kerroin on kasvanut noin 1.9. lähtien, ja johtuu vähentyneestä testauksesta.
18/x
18/x

KYS erityisvastuualueen (Kuopio) tartuntojen määrä on vähentynyt lokakuun aikana selvästi. Sairaanhoidon huippu (24.10.) oli 13 päivää tartuntojen huipun (11.10.) jälkeen.
19/x
19/x

2x rokotteen tehon heikentyminen näkyy todennäköisesti myös HUS:n julkaisemissa luvuissa. 2x rokotettujen osuus HUS:n sairaanhoitoon otetuista potilaista on ruvennut nousemaan samaan aikaan, kun efektiivinen yli 80 prosentin rokotuskattavuus on ruvennut vähenemään. @lasleh
20/x
20/x

Suomen efektiivinen yli 80 prosentin rokotuskattavuus vähenee, mutta ei ihan niin nopeasti kuin vielä viime viikolla. Syynä on siis Länsi-Pohjan nouseva rokotusten määrä. Efektiivinen rokotekattavuus vähenee nyt 0.74 prosenttiyksikköä viikossa.
21/x
21/x

70-79 -vuotiailla efektiivisen rokotekattavuuden väheneminen on hidastunut, ja 16-19 -vuotiaiden into hakea 2. rokotus on ollut sen verran kova, että he ovat ohittaneet 20-24 -vuotiaat, 25-29 -vuotiaat, ja viimeisen parin päivän aikana myös 30-34 -vuotiaat.
22/x
22/x

• • •
Missing some Tweet in this thread? You can try to
force a refresh