Scotland: 2021 mortality through week 43 (NRS)
1/ Overall
Yet another really high week.
Week 42 was revised up to being +25% from the 5yr average, and this week is +26% (+272 additional deaths). 23rd consecutive week of excess - the longest bad streak on record.
1/ Overall
Yet another really high week.
Week 42 was revised up to being +25% from the 5yr average, and this week is +26% (+272 additional deaths). 23rd consecutive week of excess - the longest bad streak on record.

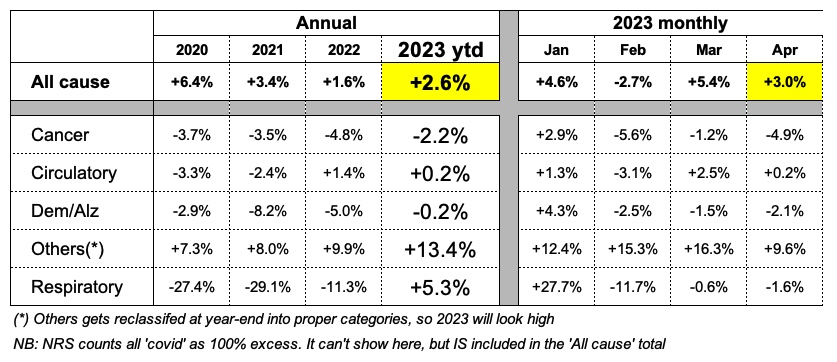
2/ Excess by cause
The majority continues to be non-covid as we’ve been seeing since the start of summer, but ‘covid deaths’ (death by any cause within 28 days of a positive test) making up a sizeable amount, as has been the case recently
The majority continues to be non-covid as we’ve been seeing since the start of summer, but ‘covid deaths’ (death by any cause within 28 days of a positive test) making up a sizeable amount, as has been the case recently

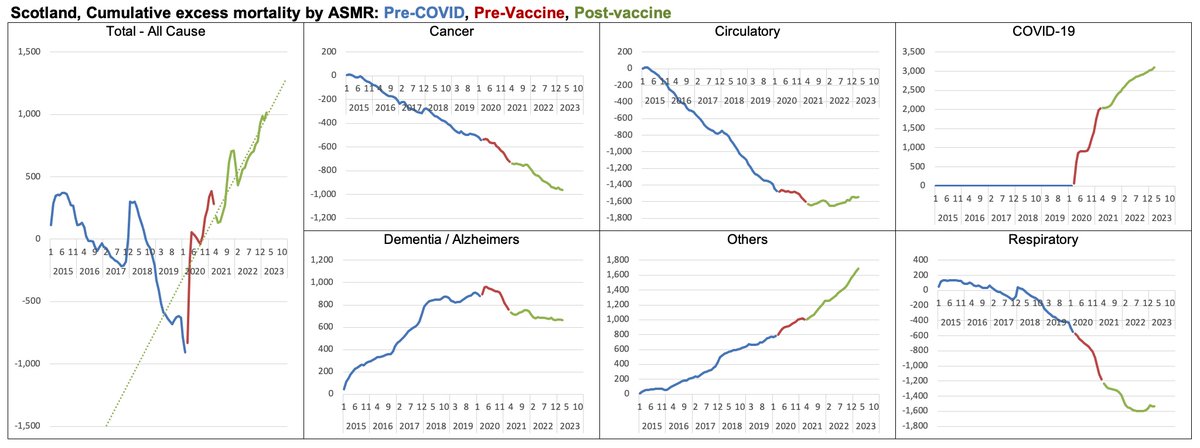
2b/ Excess by cause
Breaking this down, we see weekly and cumulative excess for each cause.
Several notable points, especially sharp inflection in heart/stroke from a pre-summer plateau.
Breaking this down, we see weekly and cumulative excess for each cause.
Several notable points, especially sharp inflection in heart/stroke from a pre-summer plateau.

3a/ Excess by location of death
Excess mortality continues mainly at home, however hospital has gone from a negative (below normal) to a consistent weekly exess.
Excess mortality continues mainly at home, however hospital has gone from a negative (below normal) to a consistent weekly exess.

3b/ Excess by location of death
This perhaps shows more clearly, weekly and cumulative by location.
Hospital was always negative, until around week 13 when the trend reversed and has grown ever since.
(Note all scales are the same, for comparison)
This perhaps shows more clearly, weekly and cumulative by location.
Hospital was always negative, until around week 13 when the trend reversed and has grown ever since.
(Note all scales are the same, for comparison)

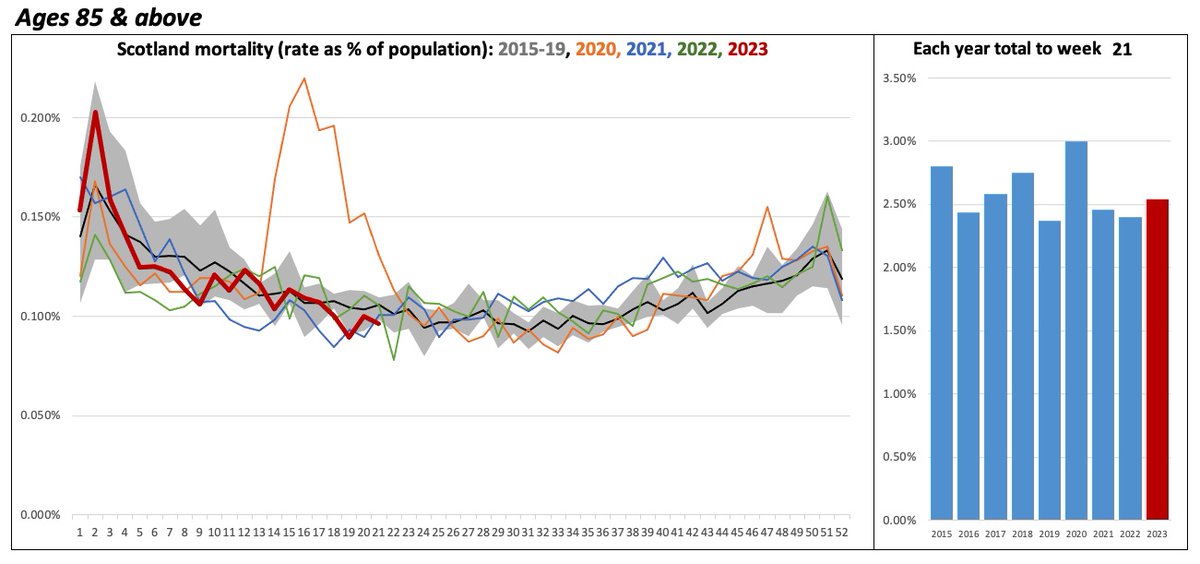
4a/ Total mortality by age group
The 15-44 age group remains stable, but all others continue to be higher than the 5 year average
The 15-44 age group remains stable, but all others continue to be higher than the 5 year average

4b/ Cumulative summer excess by age group
We continue to see the ‘staged’ ramped up of excess mortality, eldest rising first, then next eldest and so on.
45-64 shows a flattening, but only one week so need to see trend. 15-44 on 5 year average
We continue to see the ‘staged’ ramped up of excess mortality, eldest rising first, then next eldest and so on.
45-64 shows a flattening, but only one week so need to see trend. 15-44 on 5 year average

4c/ Weekly and Cumulative excess by age group
This shows the weekly and cumulative excess for each age group, both this year and 2021.
(Note scales are different for each, which can compress differences)
This shows the weekly and cumulative excess for each age group, both this year and 2021.
(Note scales are different for each, which can compress differences)

4d/ Cumulative excess by 5 year age band - 2020 and 2021 versus five year average
Like the previous, but broken down more finely. Notably several age groups are (a) higher excess than 2020, and (b) rising trend in *summer*. Very unusual.
Like the previous, but broken down more finely. Notably several age groups are (a) higher excess than 2020, and (b) rising trend in *summer*. Very unusual.

5/ Excess summer mortality in Scotland
This summarises the excess seen through summer, which is;
- Primarily ‘Others’ (73% non-respiratory/covid)
- Almost exclusively at home (hospital now rising)
- Higher the age, higher the excess
This summarises the excess seen through summer, which is;
- Primarily ‘Others’ (73% non-respiratory/covid)
- Almost exclusively at home (hospital now rising)
- Higher the age, higher the excess

6/ Total mortality and vaccination doses, by week

7a/ Child mortality (1-14 years)
Quite normal here, running at the same level as 2020, and both below the five year average.
Quite normal here, running at the same level as 2020, and both below the five year average.

7b/ Child mortality (<1 years)
We need to be careful with the 2021-Q4 average as it is an average of only four weeks, but even the weekly moving average (solid orange line) has been a bit elevated since early summer.
Birthrate has been higher which may explain. But, a little high
We need to be careful with the 2021-Q4 average as it is an average of only four weeks, but even the weekly moving average (solid orange line) has been a bit elevated since early summer.
Birthrate has been higher which may explain. But, a little high

8/ Excess mortality, by region
Looking at this by region to see if any differing trends geographically. They continue to trend up, although Lothian now flattened off for three weeks, which is positive.
Looking at this by region to see if any differing trends geographically. They continue to trend up, although Lothian now flattened off for three weeks, which is positive.

9/ Summer mortality
Summer 2020 was +1.2% from 5yr average. This summer is 14.8% above, 3,178 higher deaths than would be expected. The trend is also worsening.
Summer 2020 was +1.2% from 5yr average. This summer is 14.8% above, 3,178 higher deaths than would be expected. The trend is also worsening.

9b/ Here’s how that looks for the past 40 years. Each year has deviated from the norm, but typically +3 to -5%. This summer at 14.8% increase is a very unusual event.
9c/ Cumulative summer excess
Here we see that trended week by week, and the trend continues to worse (continued / higher deviation from the 5 year average) rather than flattening off.
2020 is the dashed red line, mid to upper end of the years.
Here we see that trended week by week, and the trend continues to worse (continued / higher deviation from the 5 year average) rather than flattening off.
2020 is the dashed red line, mid to upper end of the years.

• • •
Missing some Tweet in this thread? You can try to
force a refresh