GLOBAL CARBON BUDGET 2021 🧵
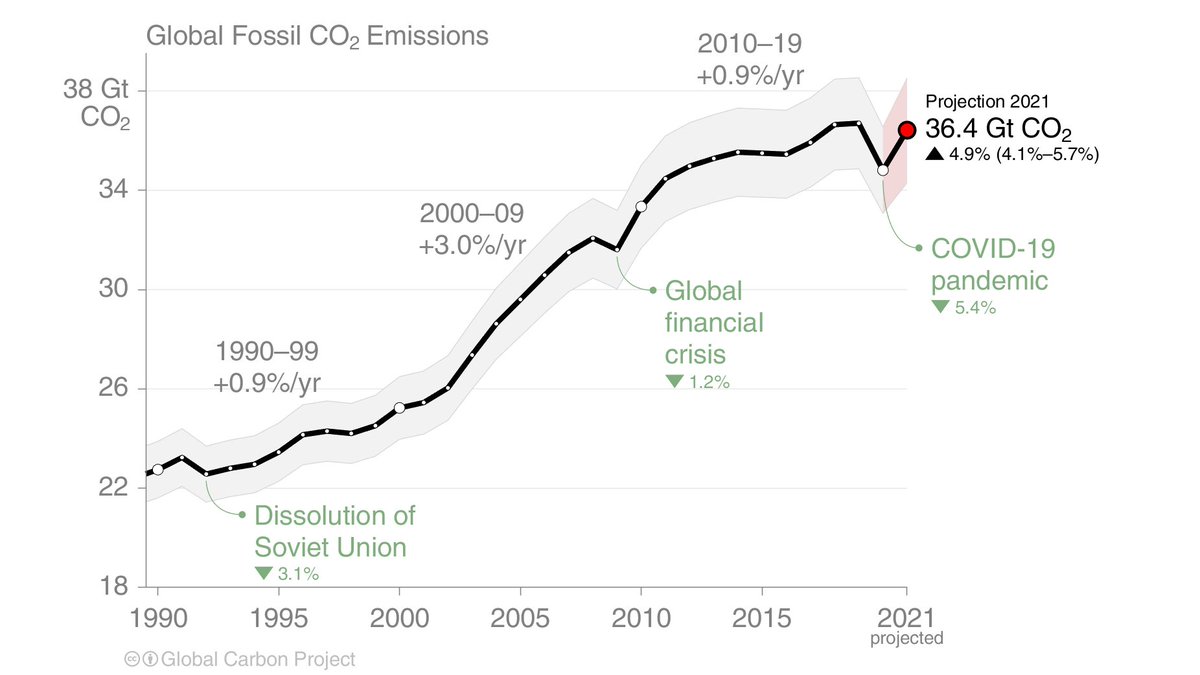
After dropping 5.4% in 2020, global fossil CO₂ emissions are expected to increase 4.9% [4.1-5.7%] in 2021, finishing just 0.8% below 2019 emission levels.
globalcarbonproject.org/carbonbudget/i…
1/
After dropping 5.4% in 2020, global fossil CO₂ emissions are expected to increase 4.9% [4.1-5.7%] in 2021, finishing just 0.8% below 2019 emission levels.
globalcarbonproject.org/carbonbudget/i…
1/
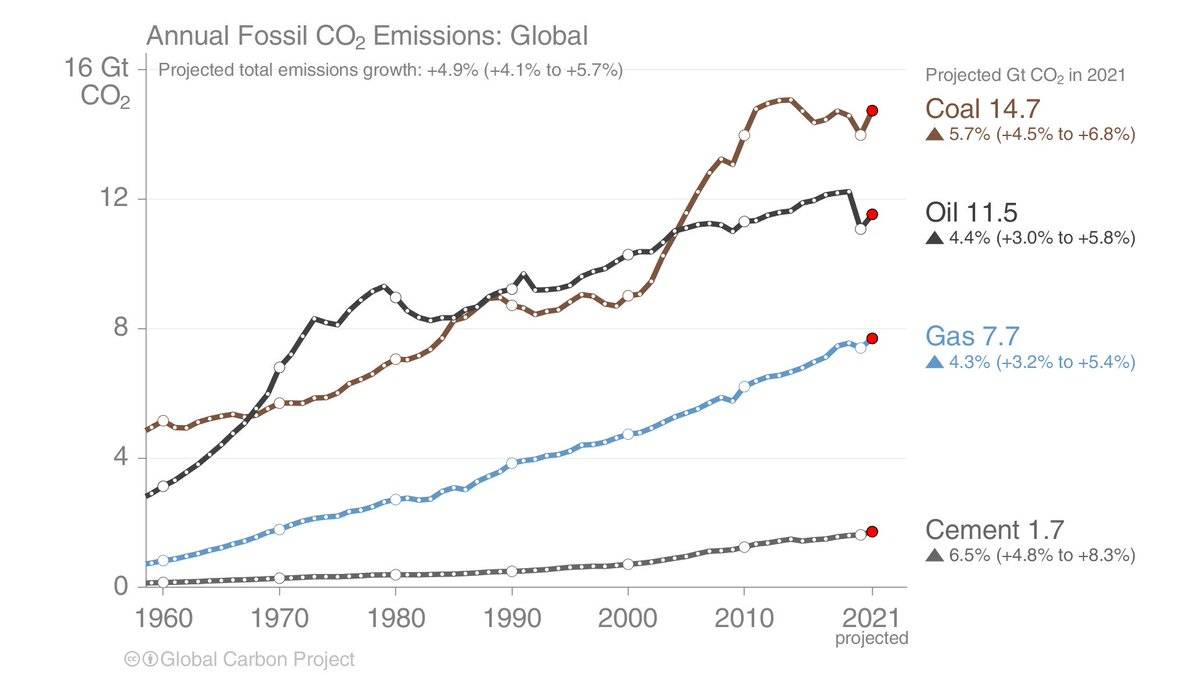
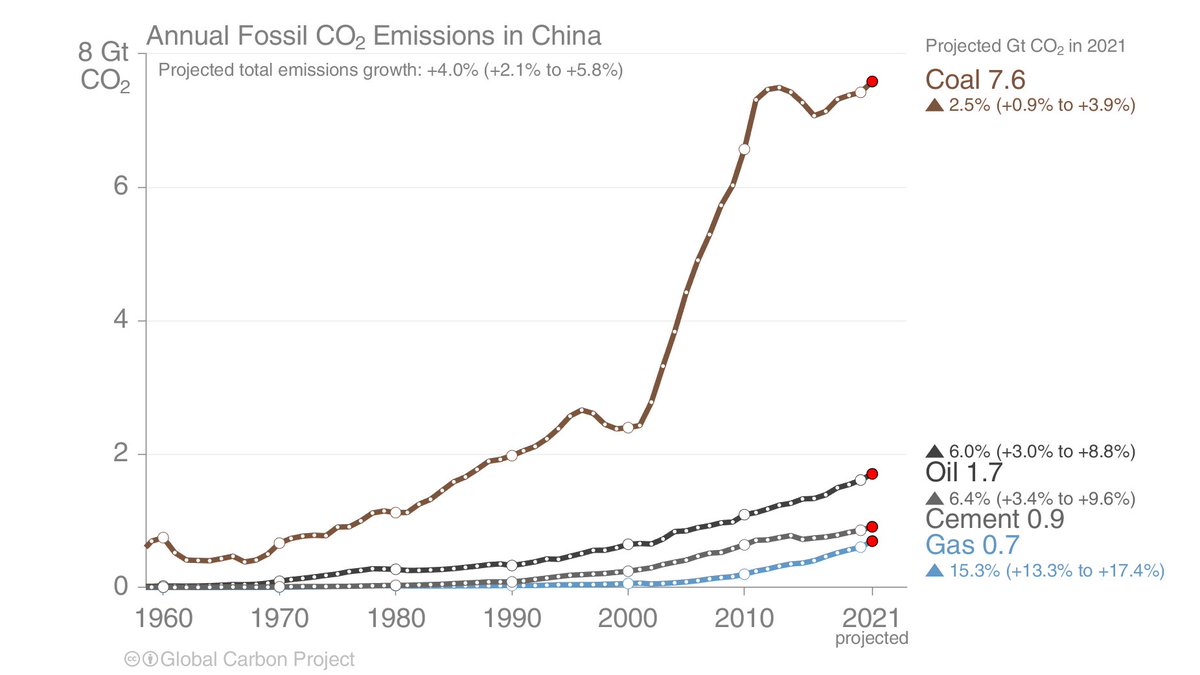
Coal & gas are now back above their pre-pandemic (2019) levels, while oil remains suppressed.
Assuming oil returns to 2019 levels in the next year or two, a drop in coal use is required to avoid further emissions growth.
2/
Assuming oil returns to 2019 levels in the next year or two, a drop in coal use is required to avoid further emissions growth.
2/
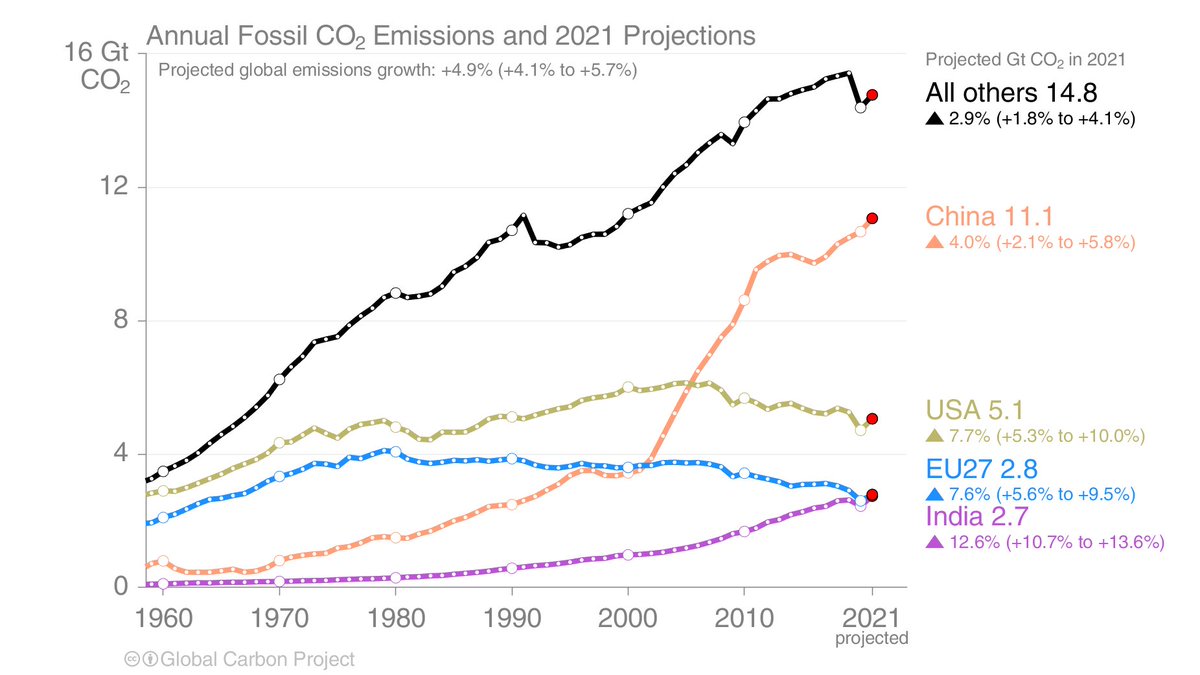
China grew in 2020 & especially 2021, now with solid growth since 2016.
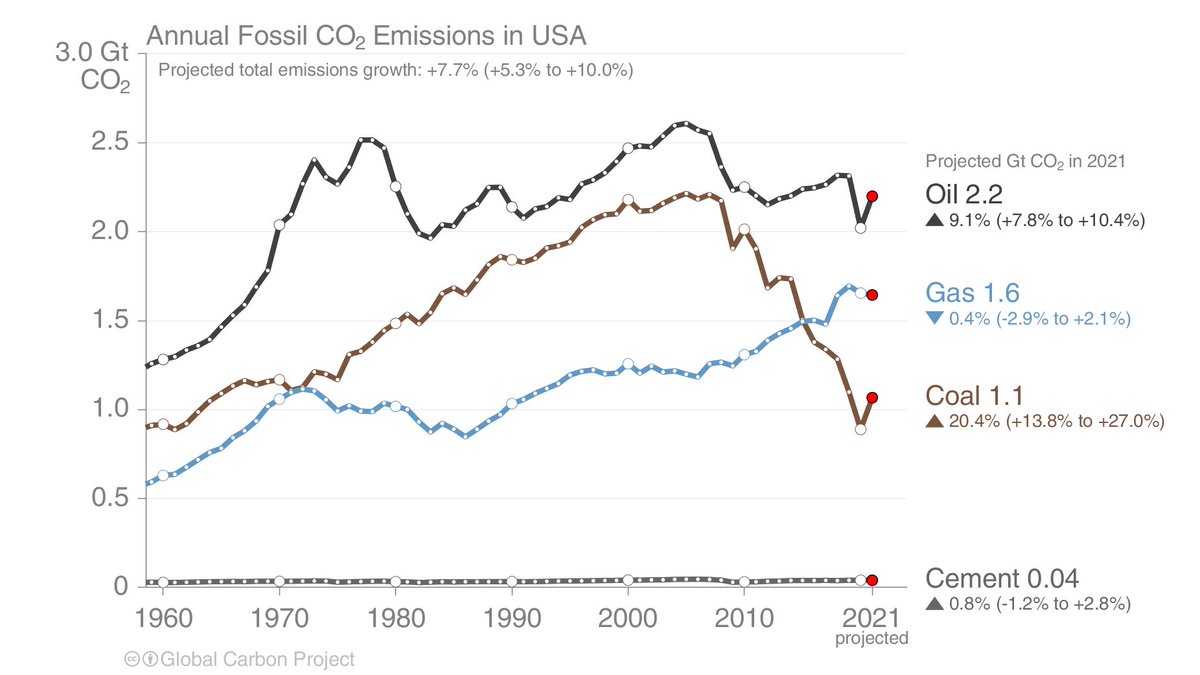
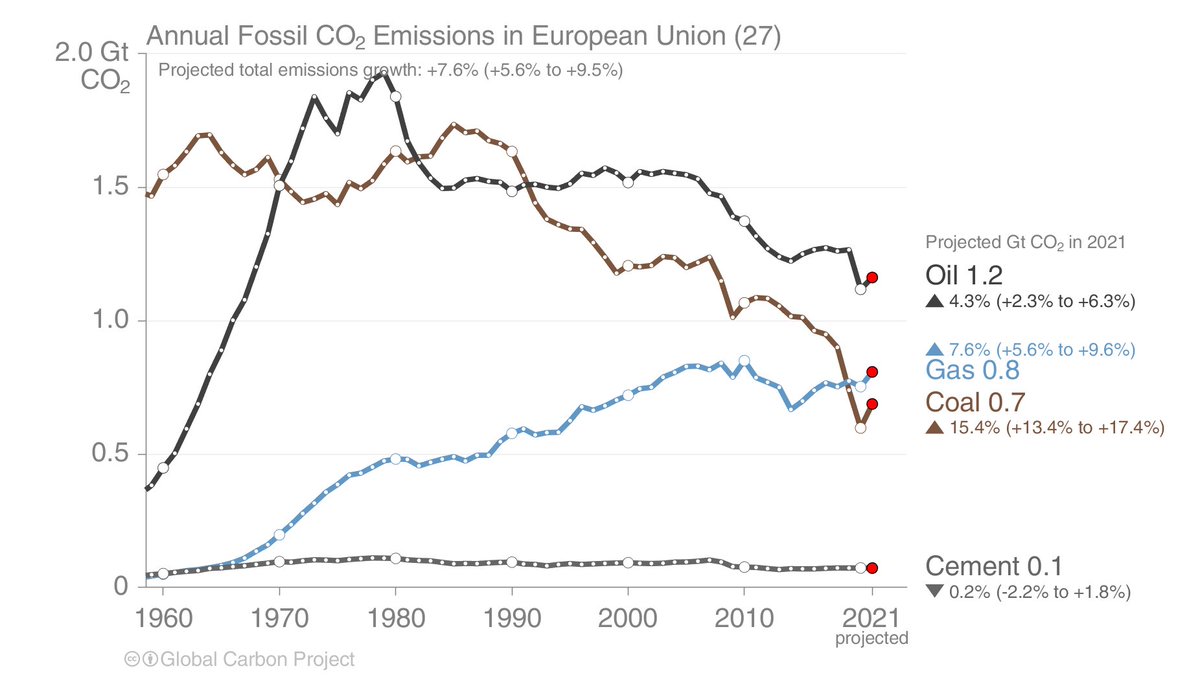
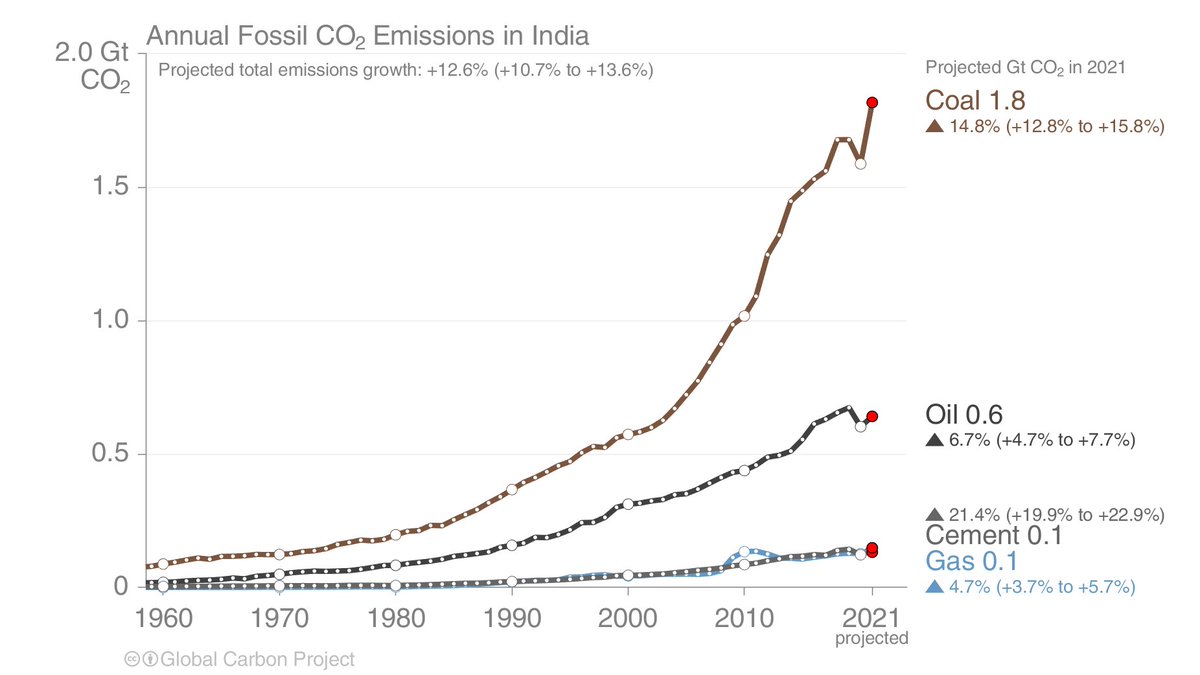
Other major countries had a rebound which puts them back on their decade trends.
The recovery is also uneven across smaller countries (all others).
3/
Other major countries had a rebound which puts them back on their decade trends.
The recovery is also uneven across smaller countries (all others).
3/
Our projections are the hard work of @robbie_andrew & @jikorsbakken, who use monthly energy data to estimate emissions & then project forward for the months without data.
This means we have estimates by coal, oil, gas, & cement for major emitters.
4/
This means we have estimates by coal, oil, gas, & cement for major emitters.
4/
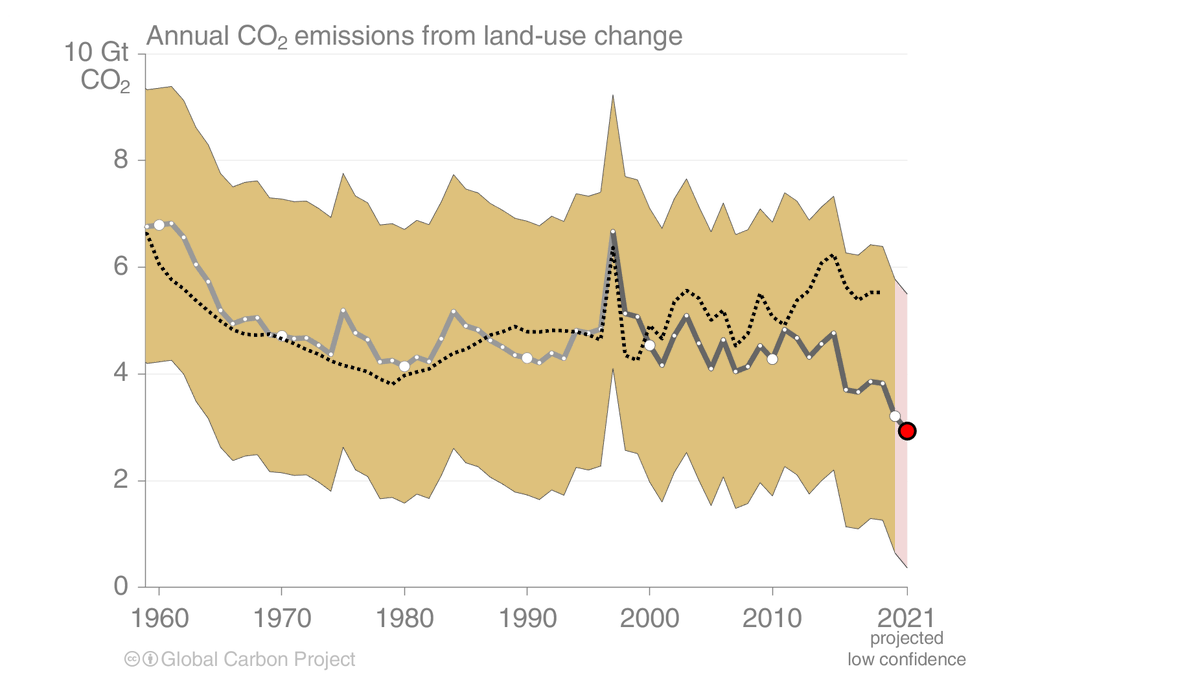
This year there was a major update of CO₂ emissions from land-use change, mainly in Brazil.
Land-use change emissions now trend downwards in the last decade instead of trending upwards in the earlier budgets (dotted line).
5/
Land-use change emissions now trend downwards in the last decade instead of trending upwards in the earlier budgets (dotted line).
5/
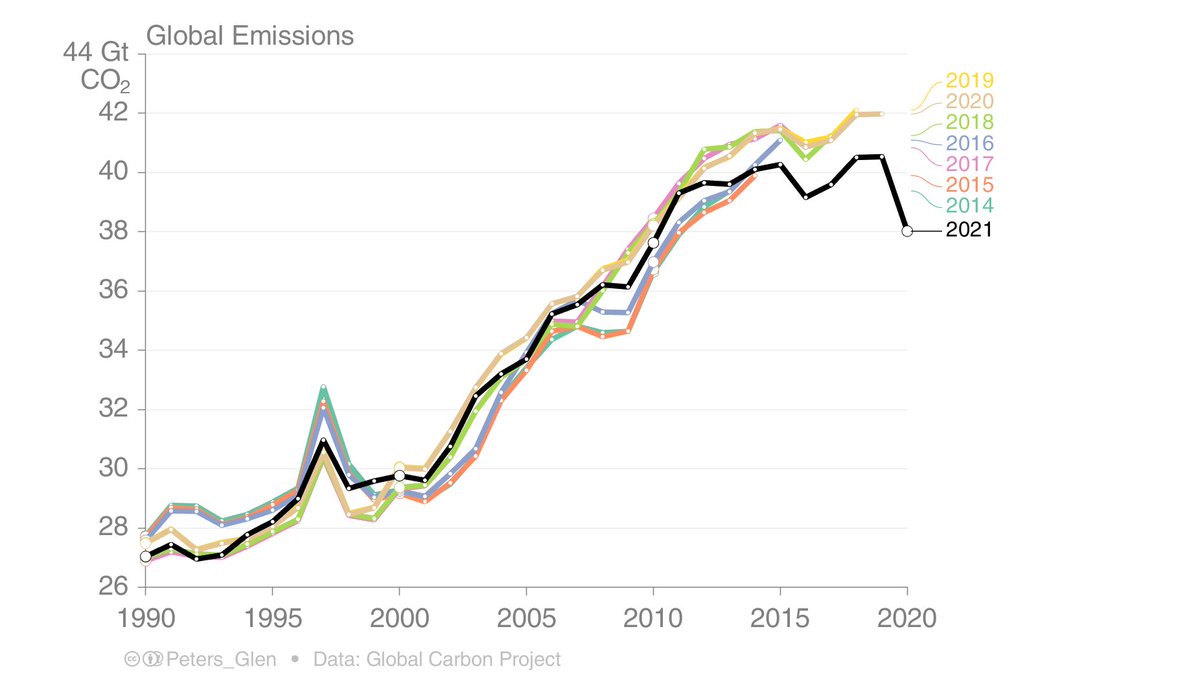
In the @gcarbonproject, we update all the data every year (come on, seriously, you think we just add an extra year?).
With the new land-use data, total emissions are now flat in the last decade.
6/
With the new land-use data, total emissions are now flat in the last decade.
6/
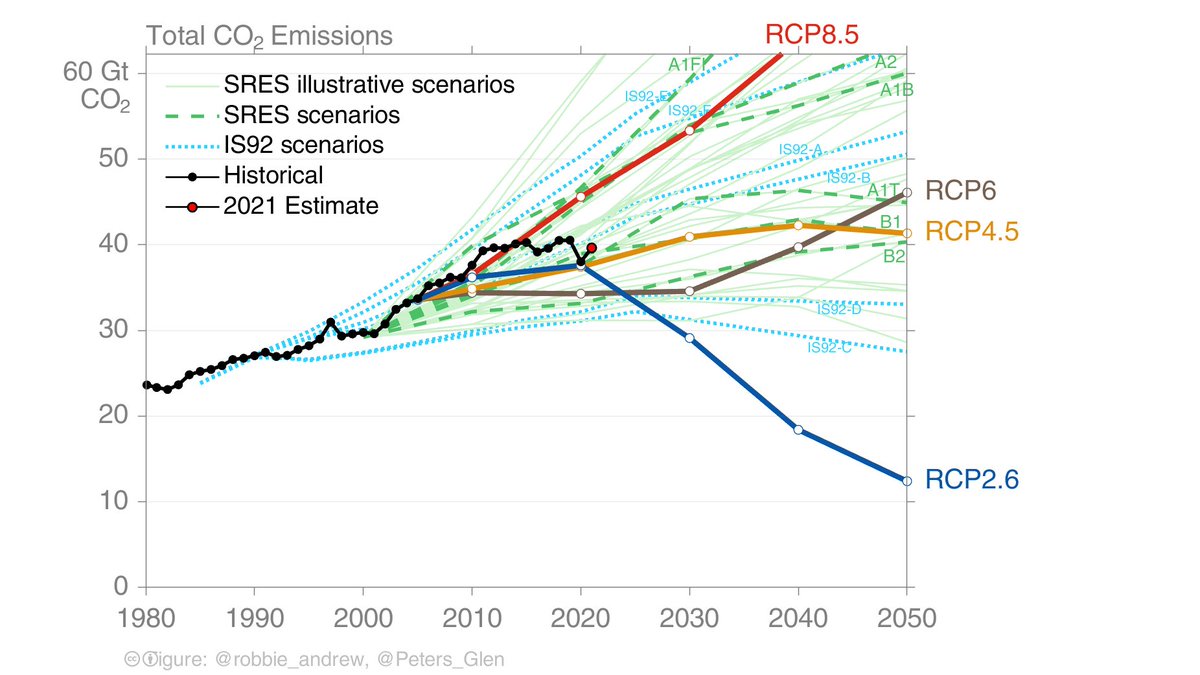
The revised LUC data does not help keep RCP8.5 alive, unfortunately (?).
Now total CO₂ emissions are clearly deviating from high-end emission pathways (this was not the case previously).
More here: nature.com/articles/d4158…
7/
Now total CO₂ emissions are clearly deviating from high-end emission pathways (this was not the case previously).
More here: nature.com/articles/d4158…
7/
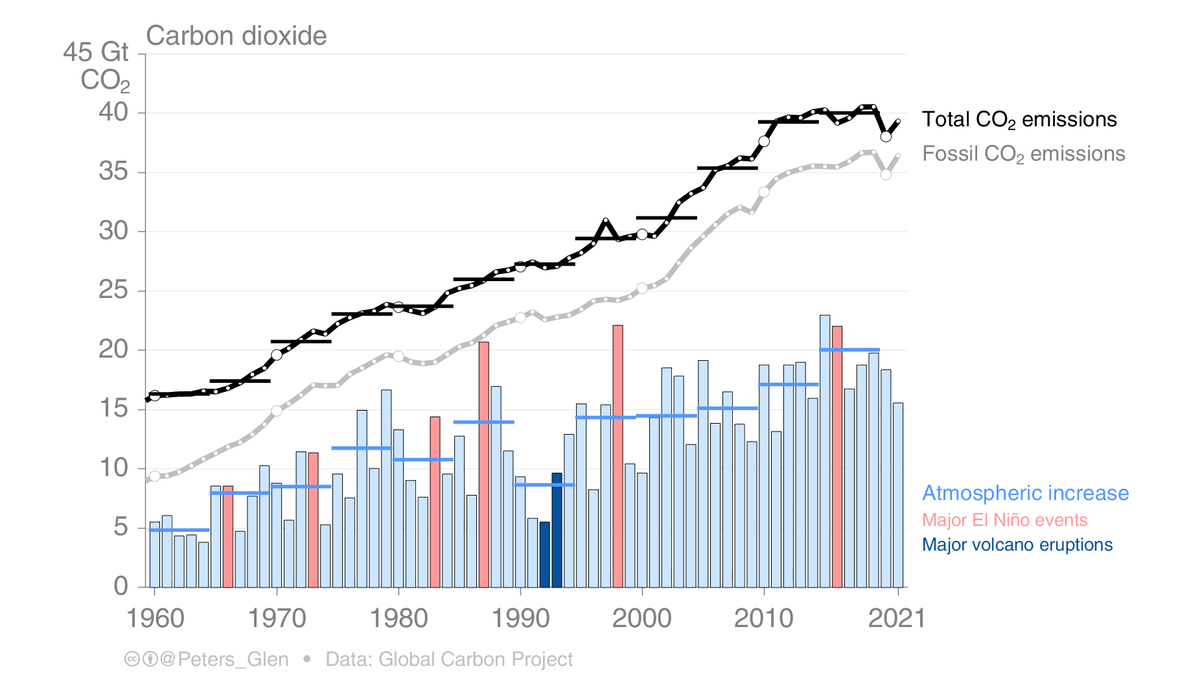
All these CO₂ emissions lead to an increase in the atmospheric concentration of CO₂, which are estimated to reach 415 parts per million (ppm) this year.
@robbie_andrew uses available observational data & projects for the rest of the year using the seasonal cycle.
8/
@robbie_andrew uses available observational data & projects for the rest of the year using the seasonal cycle.
8/
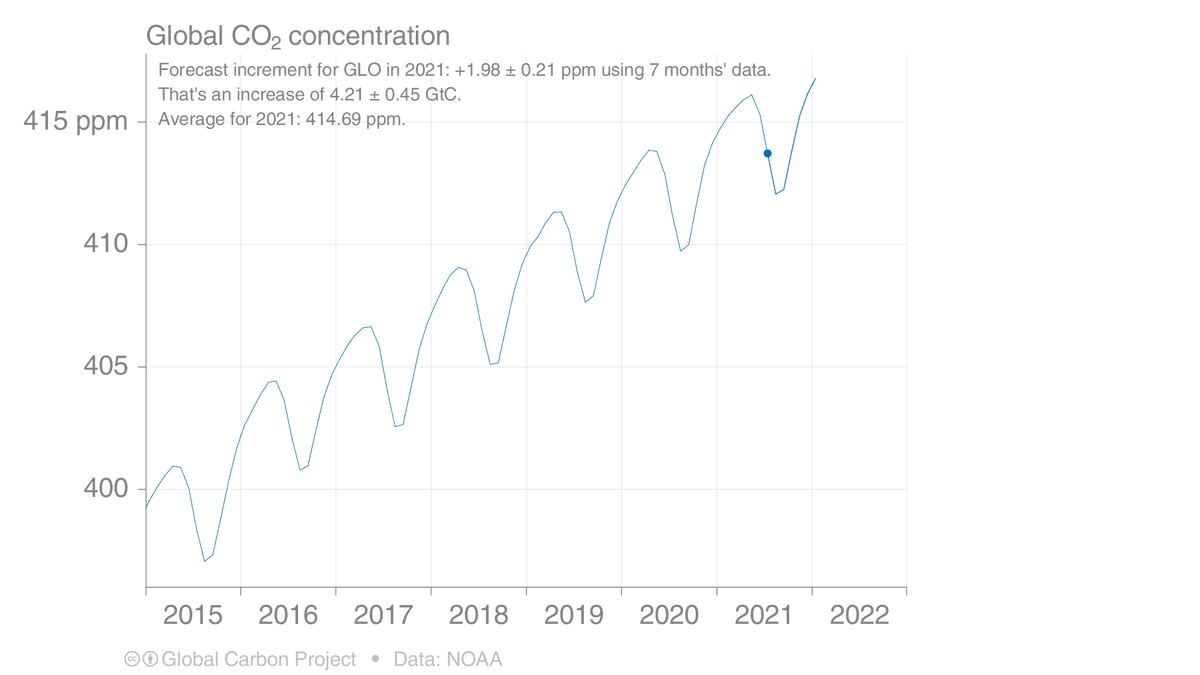
In the last decade, the atmospheric CO₂ increase has averaged ~2.4ppm.
Even though emissions dropped 5.4% in 2020, CO₂ increased 2.4ppm.
In 2021 emissions went up 4.9%, but CO₂ may increase only 2.0ppm.
Why? rdcu.be/buifD
/9
Even though emissions dropped 5.4% in 2020, CO₂ increased 2.4ppm.
In 2021 emissions went up 4.9%, but CO₂ may increase only 2.0ppm.
Why? rdcu.be/buifD
/9
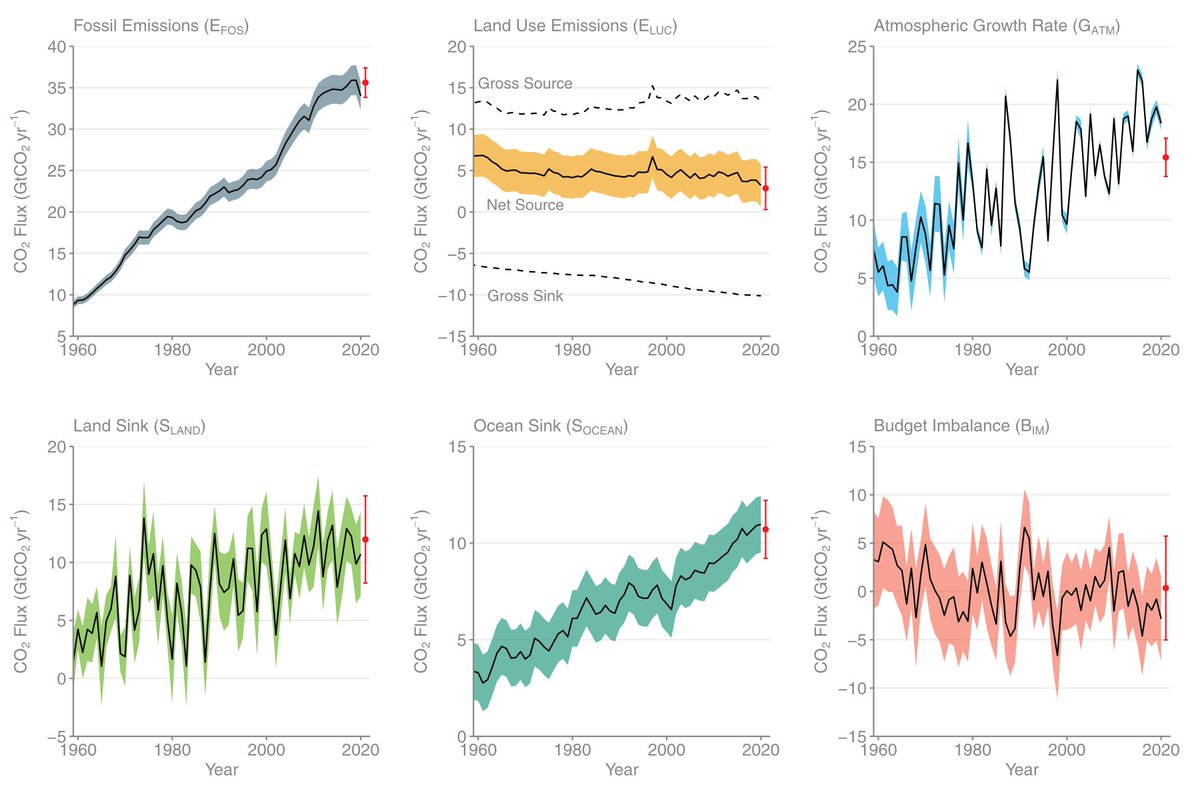
Understanding the year-to-year changes in the carbon cycle is why we update carbon budget annually.
We now also project all components of the budget to the current year!
This baseline historical data is critical to help improve future modelling, like in @4C_H2020
10/
We now also project all components of the budget to the current year!
This baseline historical data is critical to help improve future modelling, like in @4C_H2020
10/
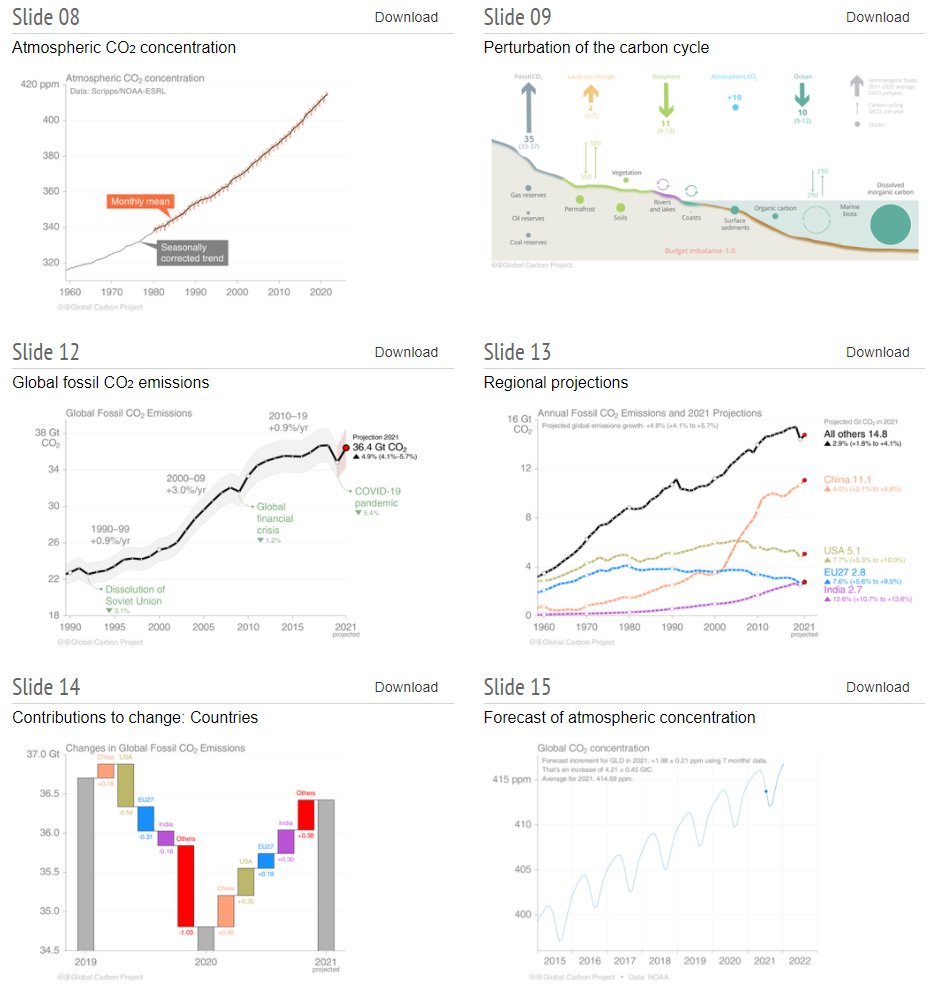
This thread is only a flavor of the global carbon budget:
* Find links to all the resources here: globalcarbonproject.org/carbonbudget/i…
* All the figures & data here tinyurl.com/GCB21figs
Thanks to the almost 100 colleagues for the hard work!
11/11
* Find links to all the resources here: globalcarbonproject.org/carbonbudget/i…
* All the figures & data here tinyurl.com/GCB21figs
Thanks to the almost 100 colleagues for the hard work!
11/11
PS: Don't worry, I will tweet more in the coming days, weeks, months, years, ...
• • •
Missing some Tweet in this thread? You can try to
force a refresh