Kysymyksiä medialle. (1) Alle 12-vuotiaita on noin 12.5 prosenttia väestöstä. Kun uudet variantit leviävät koko ajan nopeammin, niin onko edes mahdollista saavuttaa riittävää rokotuskattavuutta ilman alle 12-vuotiaita?
1/x
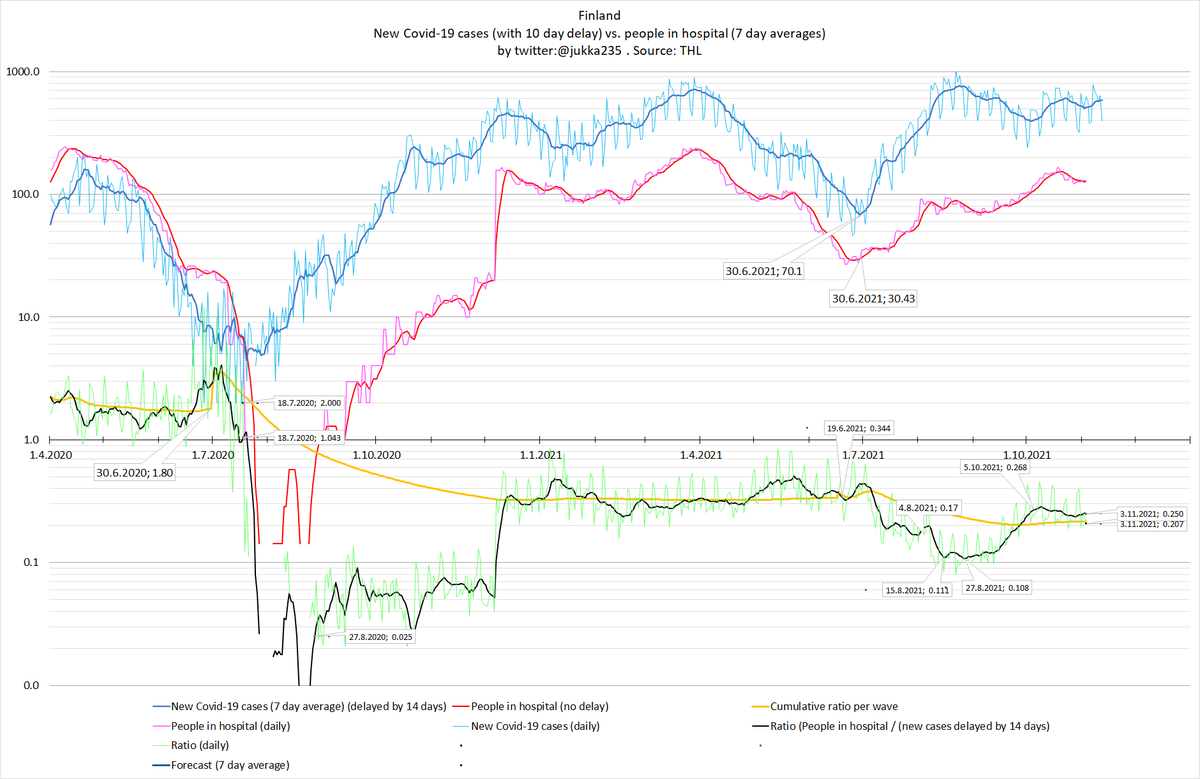
Miksi THL valitsi sairaanhoidon kuvaan sunnuntain tiedot, vaikka sen jälkeen sairaanhoidon määrä on tällä viikolla noussut selvästi ? 2/x
Sekä 7 että 14 päivän ilmaantuvuus on nousussa THL:n tietokannan mukaan. Miten on mahdollista, että THL:n mukaan tartuntojen määrä ei nouse? 3/x
Meidän jo saamamme 2. rokotukset vanhenevat koko ajan. Efektiivinen rokotuskattavuus , joka ottaa tämän jo saamiemmem2. rokousten vanhenemisen huomioon, on laskenut jo lähes kahden viikon ajan. Milloin THL alkaa julkaista tietoja rokotusten tehon laskusta? 4/x
THL sanoi juuri, että rokotusten määrän lasku on päättynyt. Luvut (päivitetty 3.11.) eivät tue tätä väitettä. 5/x
THL sanoi juuri, että teho-osaston määrät ovat puolittuneet. Minusta ne eivät ole laskeneet juuri yhtään (keltainen viiva). 6/x
THL:n mukaan epidemian tilanne on vakiintunut. Minusta ei näytä siltä. 7/x
Endeeminen = laumasuojan puolustajien käyttämä termi. Kaikki variantit ovat tuleet meille ulkomailta. Ei ne täällä sikiä, ellemme luovuta.
8/x
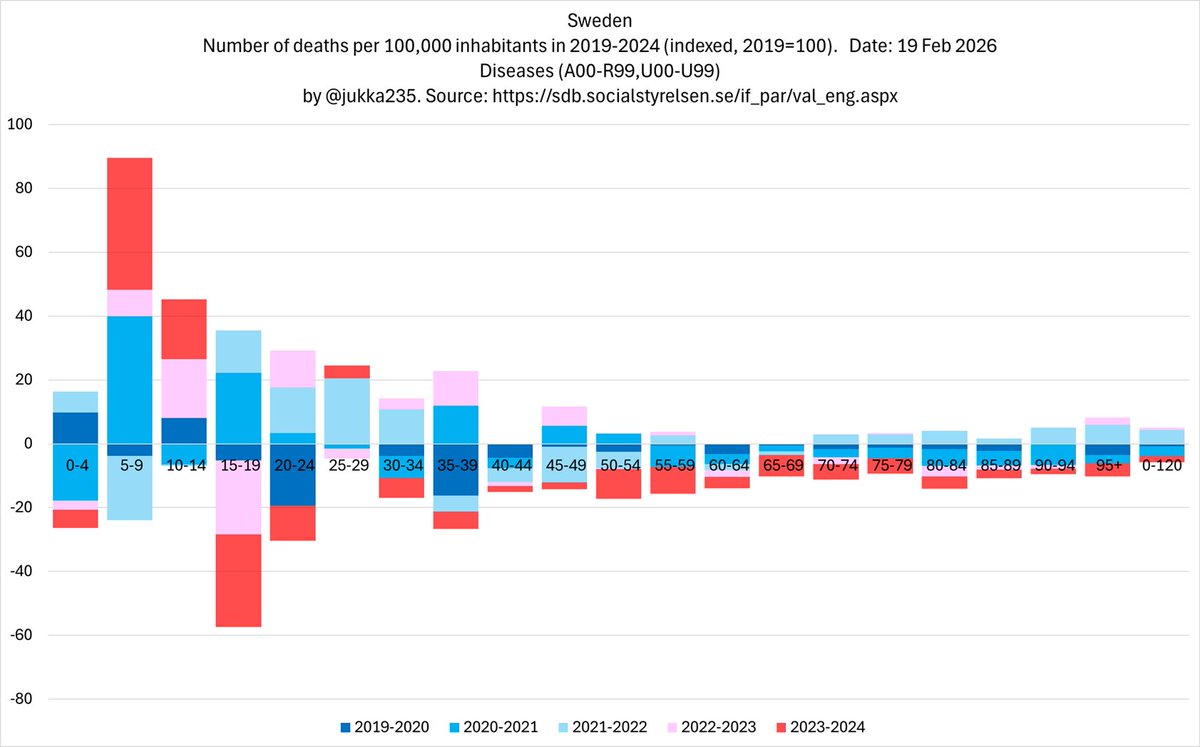
THL:n mielestä kuolemien määrät eivät välttämättä kuvasta tautitapausten lukumäärää. Lukujen perusteella kuolemat ovat kuitenkin seuranneet sairaanhoidon määriä erittäin tiiviisti. 9/x
... ja sairaanhoitoon joutuneiden osuuden suhde tartuntoihin on NOUSSUT viimeisen kahden kuukauden aikana. Eli kuolemien määrä suhteessa tartuntoihin on noussut. 10/x
Milloin THL alkaa julkaista tiedot hoitohenkilöstön 1) rokotuksista 2) tartunnoista
11/x
THL ei vastannut kysymykseen siitä, että onko lapsia ollut sairaalassa myös muualla kuin Seinäjoella. On ollut mm. HUS:n alueella ja muistaakseni Vaasassa. 12/x
THL sanoi juuri, ettei 80 prosentin rokotuskattavuuden saavuttaminen näy missään. Olen samaa mieltä. Sairaanhoidon määrät kasvavat koko ajan. Mutta millä rokotuskattavuudella sairaanhoidon kasvu taittuu ? 13/x
Miksi THL jätti tiedotustilaisuudessa olleista sairaanhoidon luvuista pois juuri sen alueen (=vuodeosastolla olevat potilaat), missä sairaanhoidon kasvu on ollut kaikkein nopeinta? 14/x
Here are the 19 leading causes of death among 10-14 year olds, ranked by their 2024 incidence compared to the 1997-2019 average. Together, they account for 35% of all deaths in 2024. 2/x
Here are the next 18 diseases. Combined, these causes represent 60% of all deaths in 2024, and have an average growth rate of 33.7% per year between 2019 and 2024 (10 times in 7.9 years). 3/x
After more than five years of silence, mainstream media has begun to acknowledge that C19 can harm T cells, and to discuss the consequences that follow. @fitterhappierAJ was one of the first, if not the first, to talk about this. 1/x
Dr. Leonardi has provided a significant amount of direction for me. In particular, he has been interviewed in some excellent articles that have withstood the test of time. Here is one of them. 2/x
We have seen it all.
- in 2020, they said that our health systems are so robust that this disease wouldn't come here
- then they wanted them infected. C19 was de facto allowed to spread in schools. Only a small fraction of <12 year olds received ... 3/x
Something is causing injuries among young children. 1/x
Something changed in 2022. Before that, the numbers were generally falling. Wonder what it could be. 2/x
After 2022, 1-6 year olds have overtaken a total of three other age groups (50-64, 15-24 and 65-74 year olds), and are now clearly above the total population average. All injuries (S00-S99). 3/x
Between 2020 and 2025e, the number of patients with developmental delay or disorder diagnoses grew at an average annual rate of 21.6% (10x in 11.8 years). The fastest patient growth was seen in pervasive developmental disorders, incl. autism and Asperger syndrome (F84). 2/x
Among total population, number of patients with developmental delay or disorder diagnoses is up 2.6 times since 2020. All disorders are showing continued significant patient growth. 3/x
Finland's epidemic 23 Dec 2025: amount of virus in wastewater appears to have risen above the first Omicron wave. Post-Omicron baseline is permanently higher than pre-Omicron; repeated waves are showing no diminishing. 1/x
Post-Omicron baseline is permanently higher than pre-Omicron
- before late 2021, levels were mostly 10³–10⁴.
- from 2022 onward, even troughs sit around 10⁵, or 10-100x higher
- C19 has become endemic
- constant background transmission, even outside waves 2/x
Repeated large waves in 2023–2024, not diminishing. Notable peaks:
- Apr 2023
- Nov 2023 (highest for the entire pandemic)
- Dec 2024
These peaks are:
- comparable to or higher than Omicron 2022
- evidence against a simple “each wave gets smaller” narrative 3/x
Congenital malformations, deformations and chromosomal abnormalities. For 1-6 year olds,
- the condition showing largest increase since 2022 is Down's syndrome (Q90)
- the condition showing fastest growth since 2022 is Congenital malformations of great arteries (Q25) 1/x
1-6 year olds / chromosomal abnormalities (Q90-Q99).
- Down's syndrome (Q90): average patient growth (2022-2025e) 14% per year = 10x in 18 years)
- fastest growing condition: other sex chromosome abnormalities, male phenotype (Q98), up 150% in 2025e 2/x
<1 year olds / chromosomal abnormalities (Q90-Q99):
- Down's syndrome (Q90) is the most frequent diagnosis 3/x