OK, who's ready for some charts? 🧵
https://twitter.com/bencasselman/status/1456599790586941440
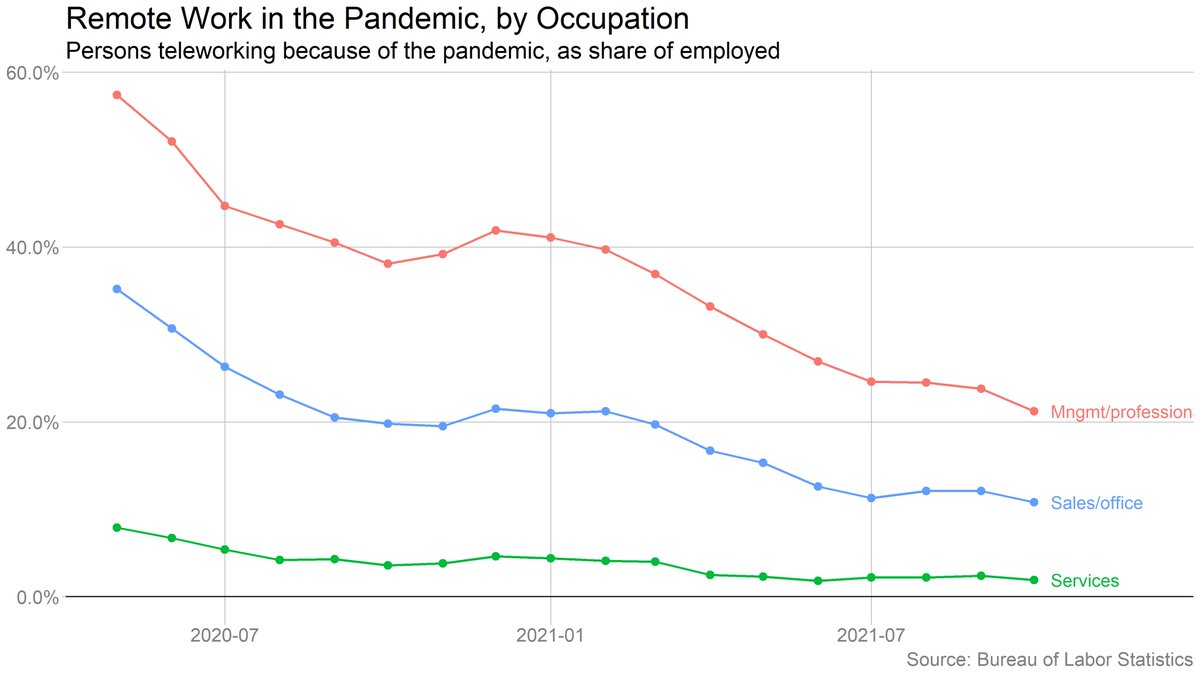
Want a sign that the economy is edging back toward normal? The share of people working from home because of Covid fell to a pandemic low of 11.6% in October. Resumed its decline after stalling out during the Delta wave. 

Notable drop in work-from-home among professional workers. Which is a good place to note that I'm tweeting this from the office.
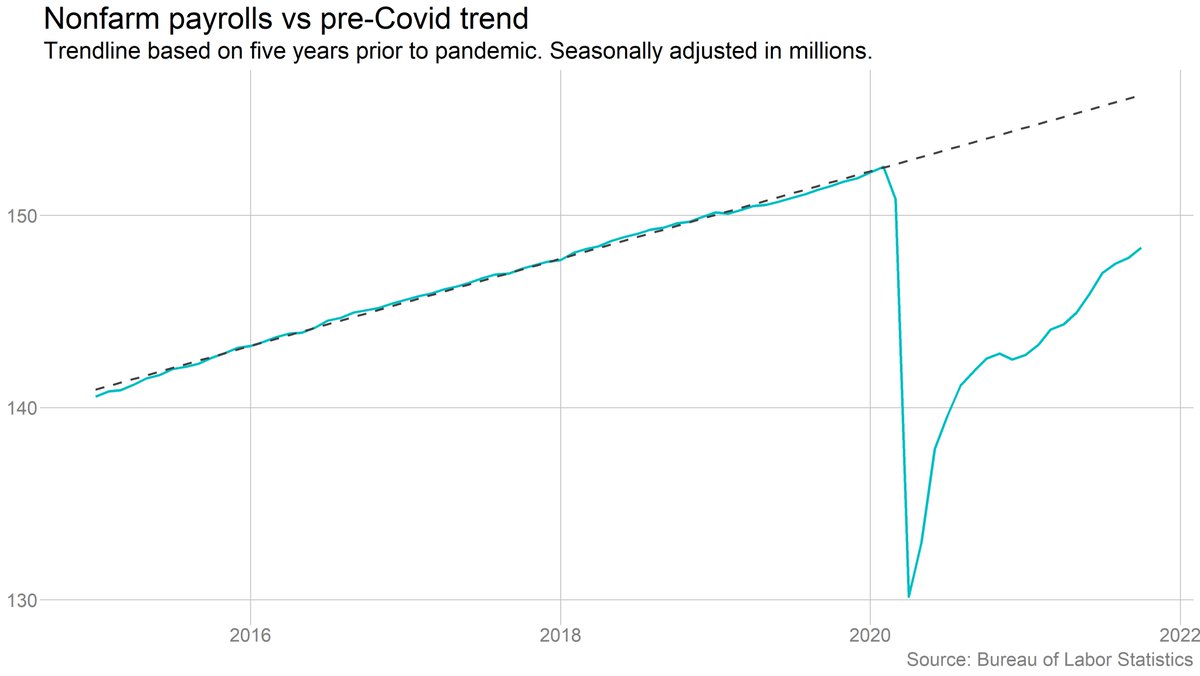
Big-picture: We're still down about 4.2 million jobs relative to our prepandemic level.

And the gap is even larger if you remember that we were adding jobs steadily before the pandemic -- so we're even further behind our prepandemic trendline.
Zooming in on 2021, job growth picked up in October, and revisions made the Aug/Sep slowdown look milder. But we still aren't adding jobs at anywhere close to our early-summer pace. Recall that last spring, many economists were predicting several months of million-plus growth.

These patterns are even clearer in leisure and hospitality: Growth picked up in October, but is still far below spring/summer rates, when the sector was driving the recovery.

And lest you think that leisure hiring is slowing down because the sector has dug out of its pandemic hole: There are still 1.4 million fewer leisure and hospitality jobs than before the pandemic.

The unemployment rate fell to 4.6%. The drop was entirely for "good" reasons, in that it was driven by more people getting jobs and fewer people being unemployed.

Broader measures of unemployment also fell. That's true of official measures that account for people who are discouraged or working part-time involuntarily, and of an unofficial measure that accounts for labor force exits.


That said, we didn't exactly see a rush back to the labor force in October. The labor force grew by just 104k. Labor force participation rate was flat.


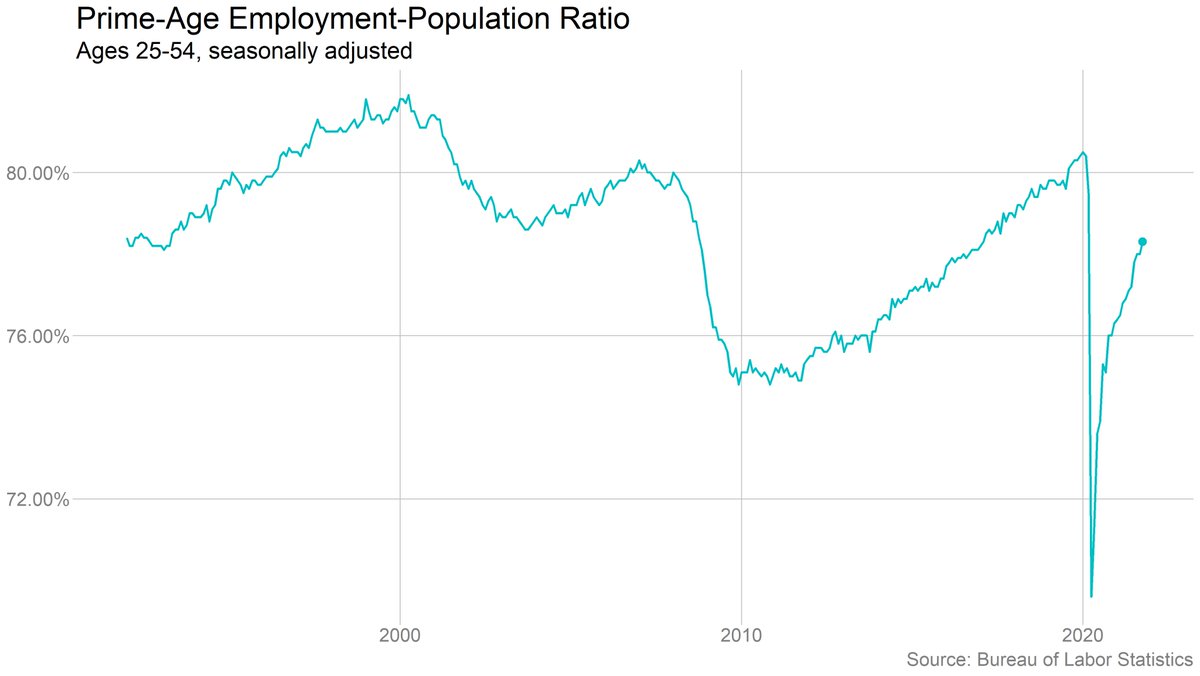
The good news from the household survey is that the *employment* rate rose, especially for prime-age (25-54) workers.

The job-finding rate -- the share of unemployed workers finding jobs -- ticked up in October, although it's basically been bouncing around. No real recent trend.
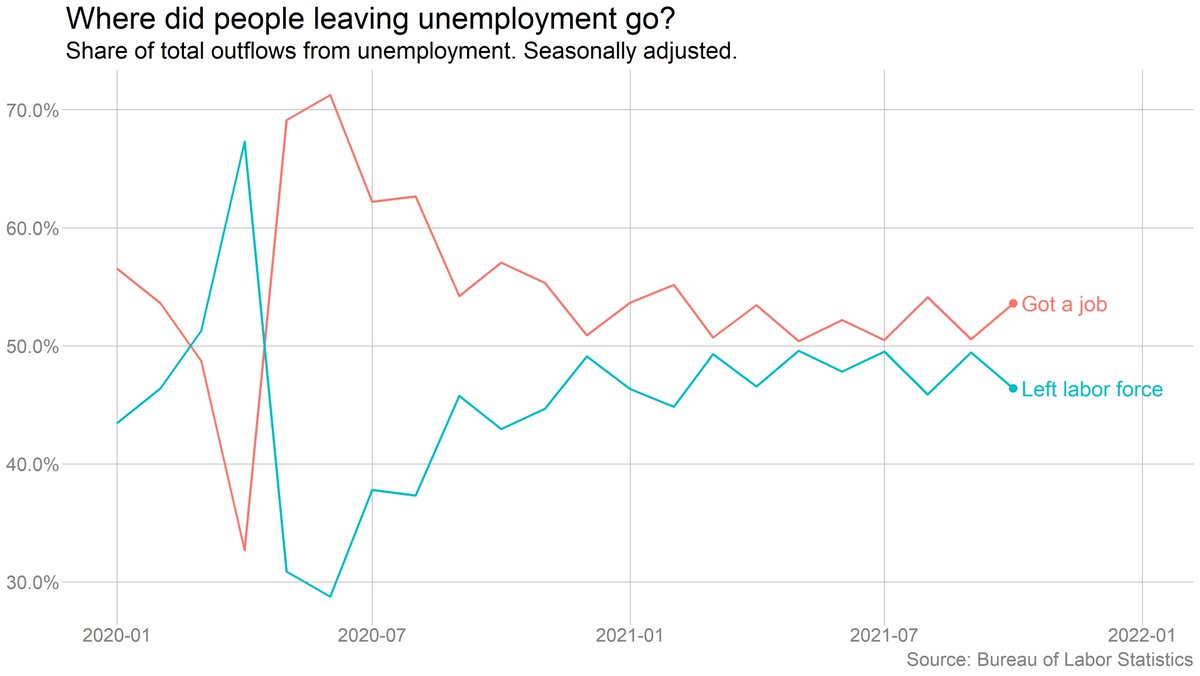
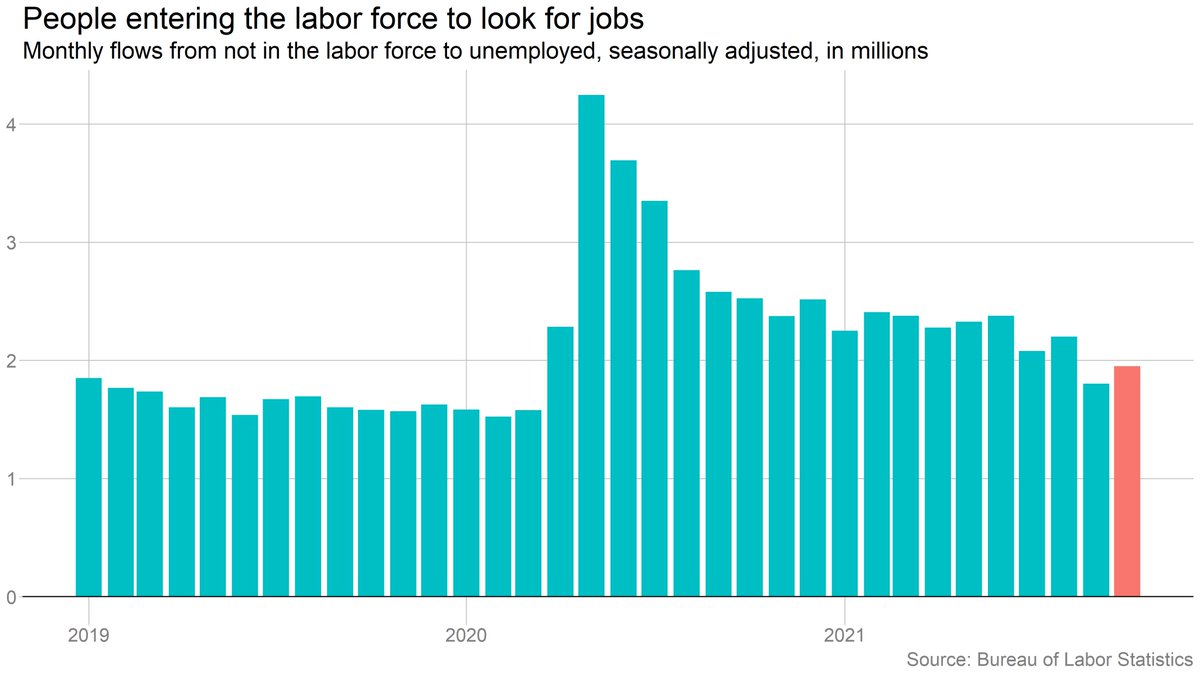
What we're not seeing is a big increase in people coming off the sidelines, either to look for work or to take jobs. Both increased in October, but not the kind of flood that many employers were hoping for.

No surprise here: Wage pressures remain intense. Overall wage growth was very strong in October, though a bit slower than in September. Earnings growth among non-supervisory workers in leisure and hospitality jumped again after briefly cooling.

(Key caveat: Average hourly earnings figures are being skewed by big compositional shifts in the labor force -- lots of low-wage workers lost jobs early on and are now returning. So interpret with a grain of salt.)
These month-to-month moves are volatile. Year-over-year, the picture is clearer: Wage growth is very strong, especially in leisure and hospitality.

It's helpful to look at this in terms of levels: Nominal earnings are way above their prepandemic trend, both overall and among leisure and hospitality workers.

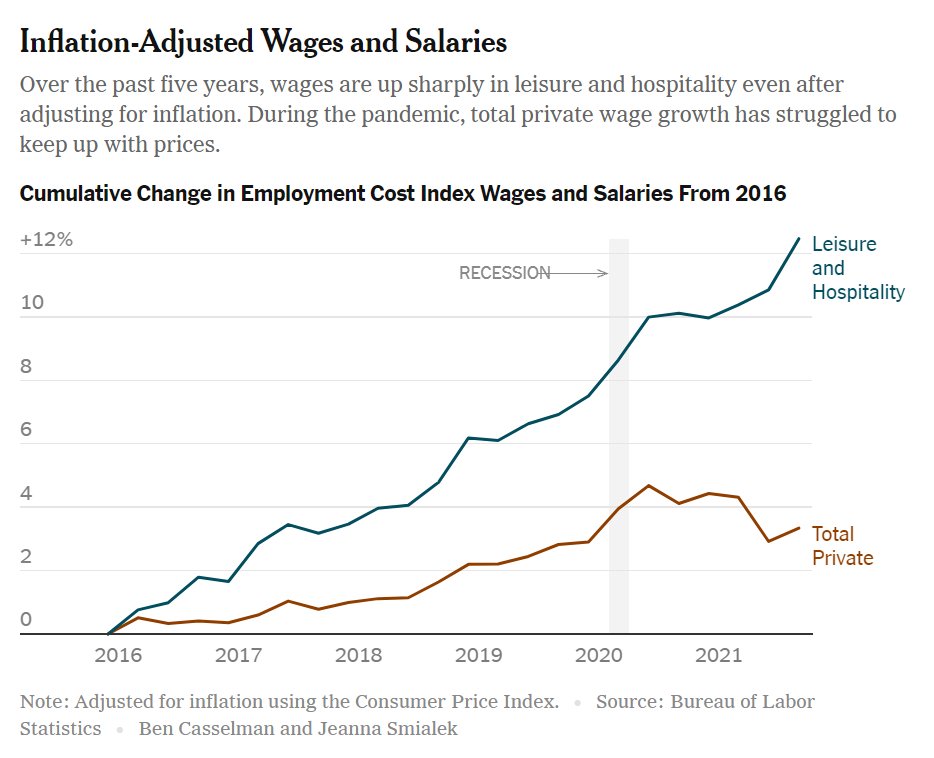
But as @jeannasmialek notes, inflation is taking a big bite out of wage growth, especially for workers as a whole. (Note: This chart is based on ECI, which adjusts for compositional shifts.)
nytimes.com/2021/11/05/bus…
nytimes.com/2021/11/05/bus…
Many people had hoped to see women return to work as schools reopened. But employment has rebounded more quickly among men in recent months.


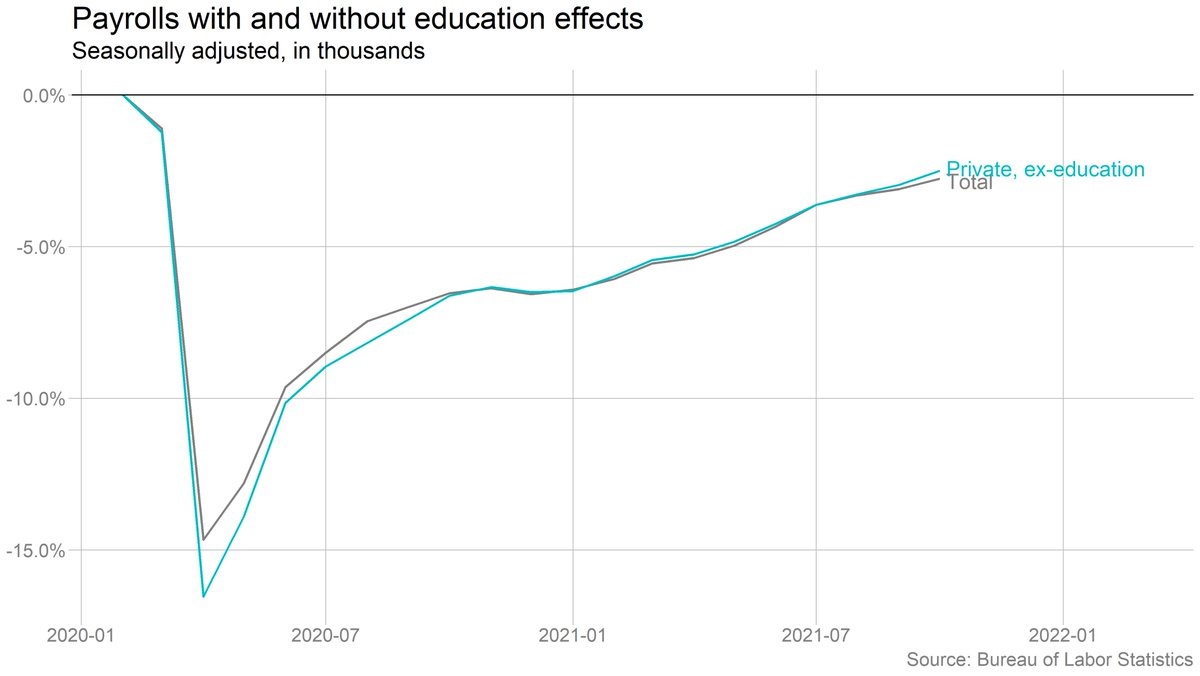
One interesting question is the degree to which the monthly numbers continue to be skewed by seasonal-adjustment oddities. This is pretty plausible, given how the pandemic mucked with seasonal patterns. @BLS_gov explicitly warns of this as it pertains to the education sector.

Excluding education, job growth looked stronger in October, and the Delta slowdown looks less severe -- in part because it makes the June/July peak in payroll growth look weaker.

Note that including/excluding education doesn't make much difference in the larger question of where we are in the recovery. It just moves the timing around a bit.
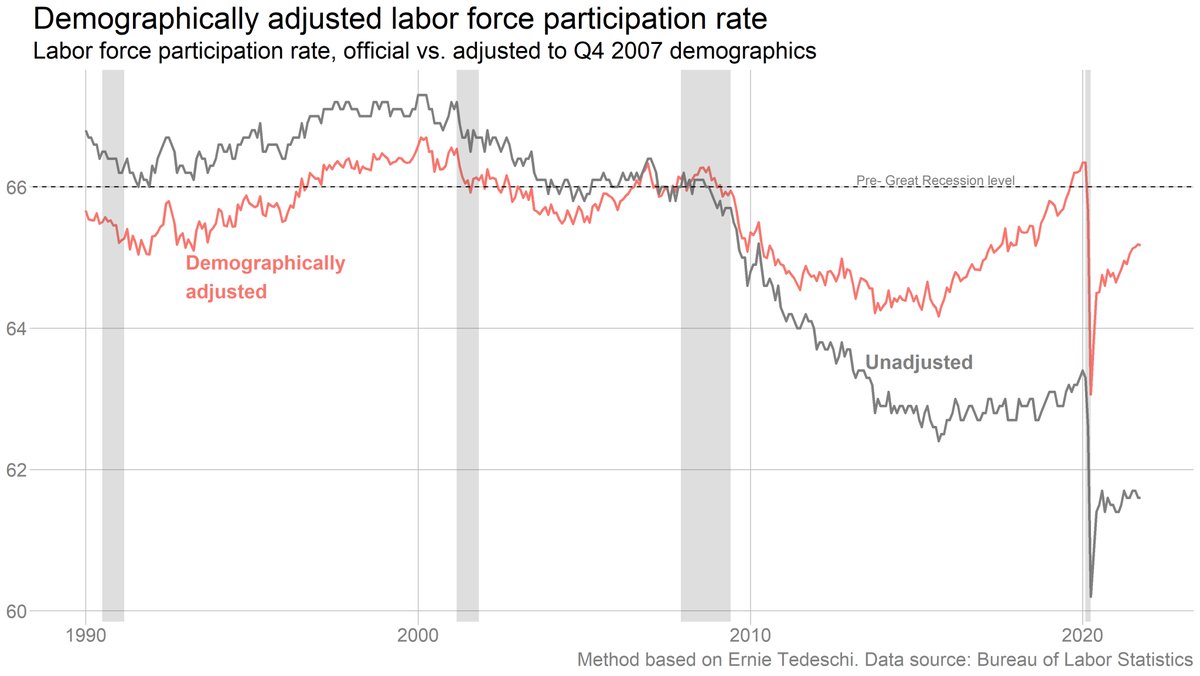
It's notable that both employment and participation look quite a bit better if we adjust for the aging of the workforce. We're almost back to where we were after the Great Recession -- though nowhere close to where we were right before the pandemic.

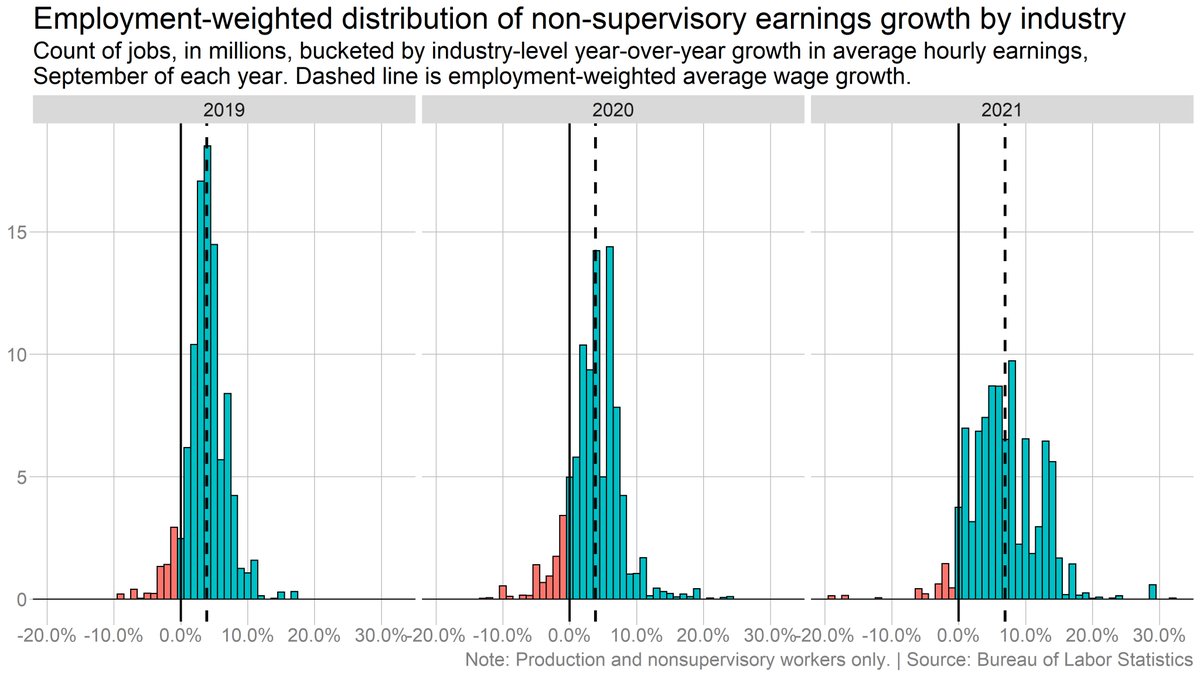
Been focusing a lot on leisure and hospitality, but the acceleration in wage growth has been broad-based. Here's how the distribution of wage growth has shifted -- far more industries are seeing strong gains in 2021 than in 2019 (which was already a pretty strong labor market!).
Earnings growth is gradually picking up in mid- and high-wage sectors, but it's really the low-wage sectors where earnings are taking off.
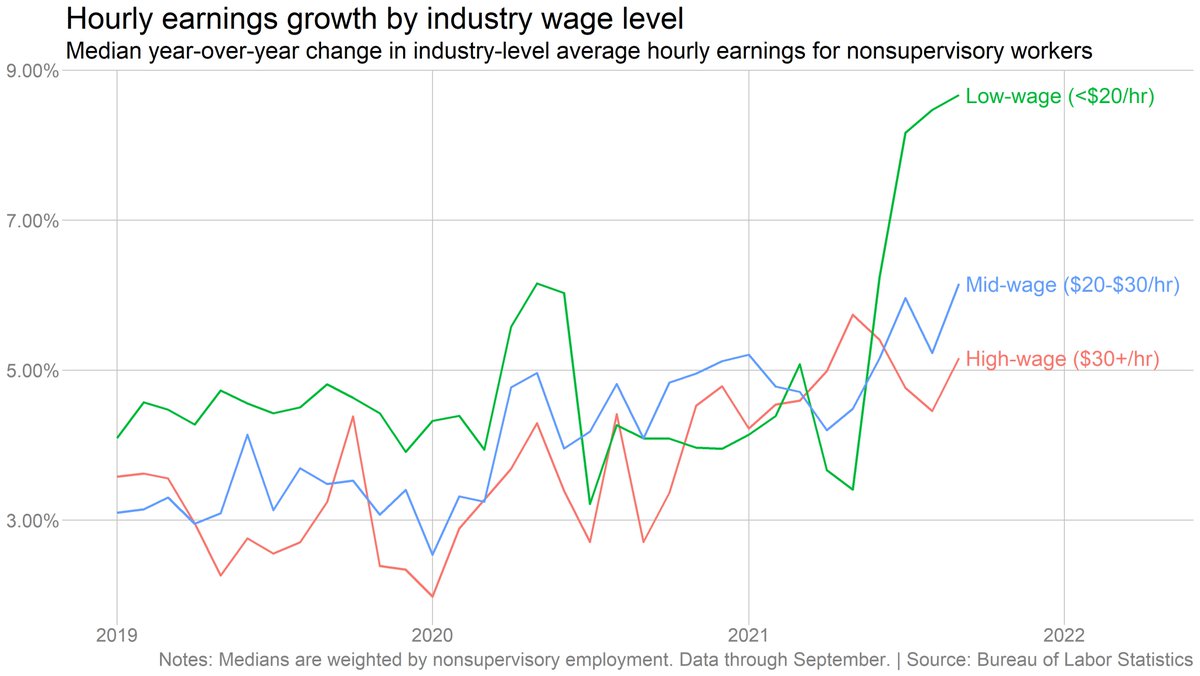
(Note that those last two wage charts are based on data through September -- the detailed industry-level data lags by a month.)
• • •
Missing some Tweet in this thread? You can try to
force a refresh