After stalling out at 78% for 2 months, the prime age employment-population ratio increased significantly to 78.3%. This essentially measures the percent of working-age people who are employed, so it makes for the clearest measure of labor market health.
The number of people employed part-time for economic reasons held steady at 4.4 million, which is close to pre-pandemic levels. This is down dramatically from the record high of nearly 11 million in April of 2020.
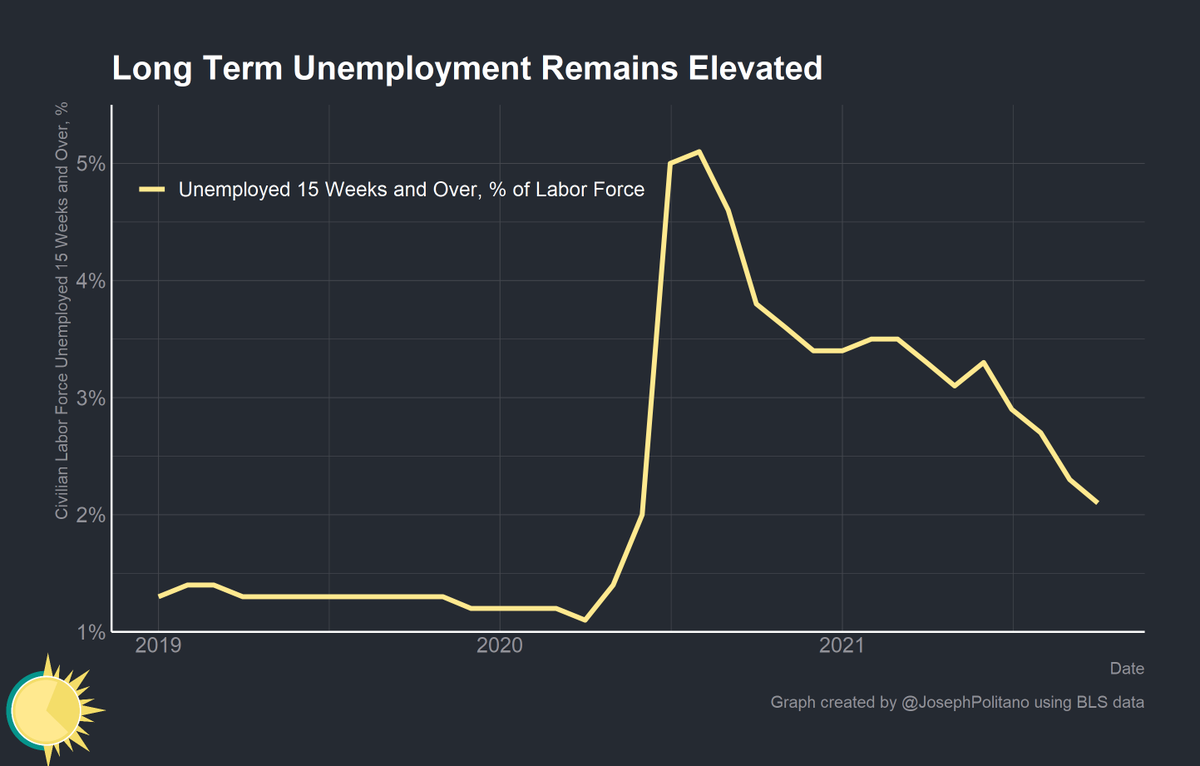
The percent of the workforce experiencing long term unemployment (15 weeks or more) also decreased to 2.1%. Long term unemployment has been on a steady decline since August 2020, when it peaked at 5.1%.
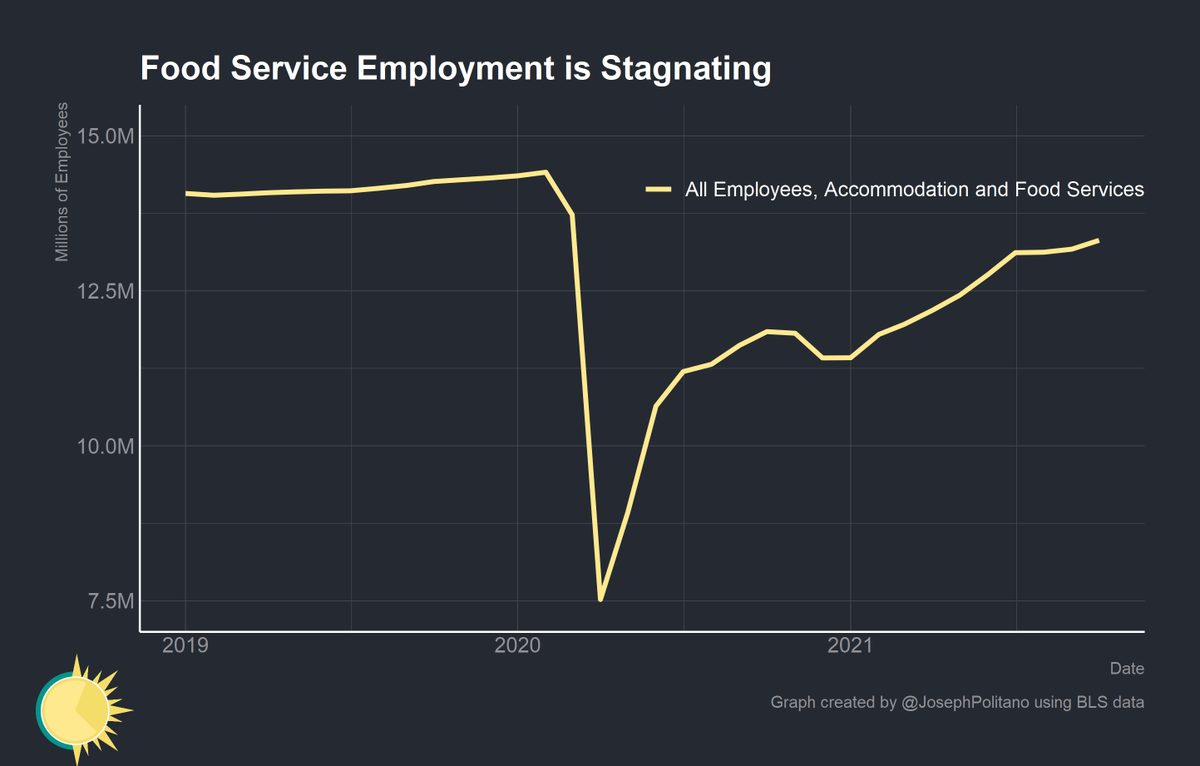
Employment in food services and accommodation, which makes up the majority of employment in leisure and hospitality, jumped up by 142,000. This is still more than 1 million jobs short of the pre-pandemic level.
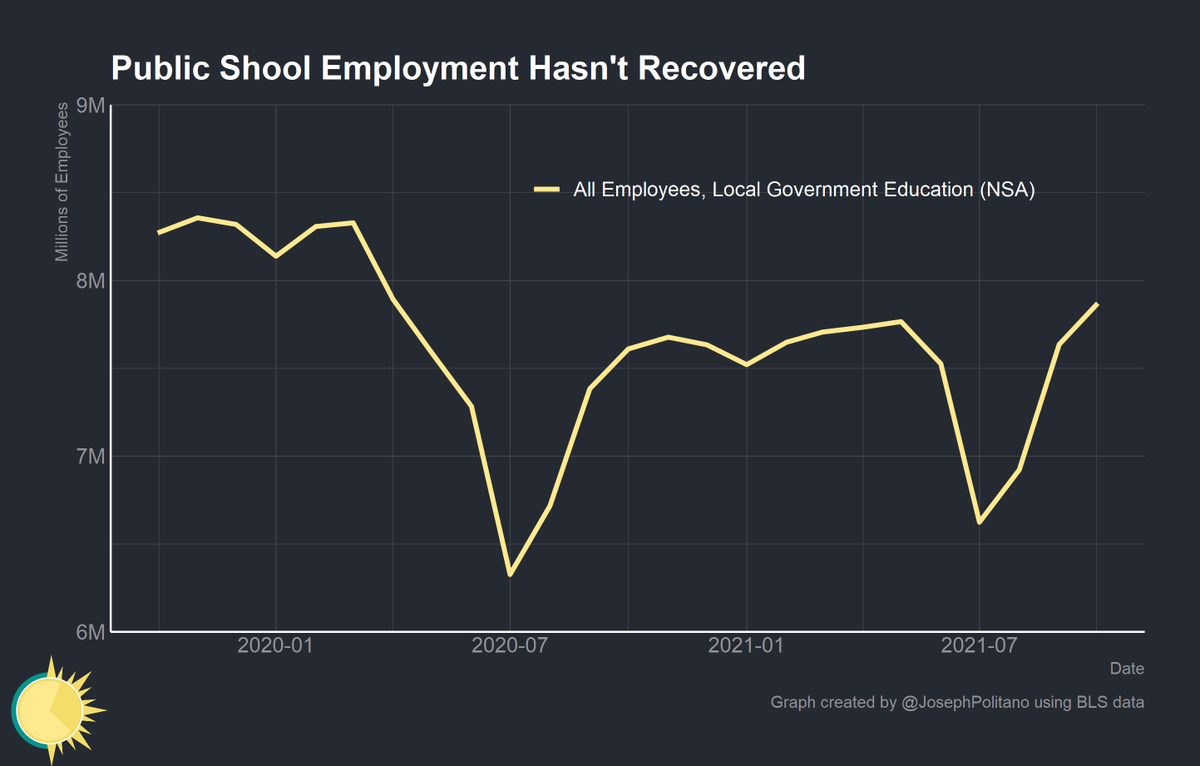
Employment in local government education is also approximately 600k jobs short. Analyzing non-seasonally adjusted (NSA) numbers is crucial, as the seasonal adjustment’s attempts to account for the summer decline in school employment has increased the data’s noise during COVID.
The jump in demand for goods caused by the pandemic has resulted in a miniature boom in the warehousing and transportation industries. A record-high 5.9 million people are employed in the transportation and warehousing industry, with little signs of a hiring slowdown.
Bottom line—the virus remains the boss, and there is still significant work to be done in order to get the virus completely under control and reach full employment.
Still, it is worth appreciating the tremendous progress coordinated monetary and fiscal policy has achieved.
If you like what I write, consider subscribing! It's free and helps me out a ton.
I'm going to be publishing a piece tomorrow about the Federal Reserve's decision to taper their quantitative easing purchases, so stay tuned!
US Real GDP came in at a -0.3% annualized growth rate in Q1 2025. Consumption increased, the trade deficit exploded, investment jumped (primarily due to inventory buildups), & public-sector output shrank
Nominal GDP growth (unadjusted for inflation) came in at 3.5% annualized🧵
The big story of Q1 was trade—and even though few of Trump's tariffs were in place by end-of-March, there was still a historic increase in the trade deficit.
This is the largest negative contribution from net exports on record, going back to 1947.
Much of the surge in imports was not related to increased consumption, but rather inventory buildup by corporations trying to get ahead of tariffs—inventory growth's contribution to GDP was the highest since late 2021
Trying to think about the state of the Effective Altruist movement and realizing Elon killing USAID probably overwhelms the total amount of good ever achieved by all EA global health donations. PEPFAR alone is $7B/yr, 10x total EA spending, & all USAID spending is only ~$30B/yr
the average USAID project is less effective than the average EA donation (because EAs are hard-filtering for the most effective known interventions) but even still USAID spends hundreds of millions on like effective anti-malaria programs, it's total impact is massive and now gone
but ya as it stands Elon's obsession with destroying USAID probably has a negative impact larger than the positive impact of the whole EA movement. Almost as large as the impact of all US charity done abroad too (only about ~$50B/yr according to Indiana U's philanthropy tracker)
Today we got new GDP by Metro area data, so here's a thread breaking down the numbers by state/region!
Starting with California, where there's been a partial rebound in the Bay Area tech hubs while SoCal growth heavily trails the national & state average.🧵
In Texas, Houston was able to claim the crown for the triangle's fastest-growth amidst a regional oil boom.
Growth in Austin & Dallas slowed to the more "normal" pace they tended to see pre-COVID, but remain well above the national average.
Growth in Florida's major metros all declined relatively uniformly, mostly settling near pre-COVID levels. That still leaves Florida as one of the fastest-growing states in the union & all major Florida metros growing significantly faster than the US average.
The post-COVID economic recovery is leaving low-income countries behind. Extreme poverty has risen since 2019, and low-income countries are no longer catching up to high-income countries.
Over the last 40 years, the world has made historic progress in reducing the scourge of global poverty. The share of the human population living on less than $2.15/day has fallen from >40% to <10%. Yet progress has been too slow—and even worse, it has now stalled.
The first 20 years of this century also saw significant economic convergence that may now be over—over the last four years, low-income countries have seen slower growth than the US while middle-income countries only see weak positive relative growth
US productivity growth, the bedrock of long-run prosperity, is booming—and massively outshining peer nations. It's the fruit of running the labor market hot post-COVID, and now it's delivering higher wages, consumption, & welfare🧵 apricitas.io/p/americas-pro…
US productivity growth was stagnant in the immediate wake of the 2008 recession—but the aggressive fiscal & monetary response to the COVID recession has meant that productivity growth not only remained strong but actually accelerated from the pre-COVID pace.
America's recent productivity growth is all the more impressive in an international context—pre-COVID, the US was already leading major peer nations in productivity growth, but post-COVID it has more than double the productivity gains of the next-fastest country.
America's industrial policy push has caused an unprecedented boom of investments in chip manufacturing, clean energy, & infrastructure
But those investments aren't spread evenly, instead having regional dynamics that are reshaping US economic geography🧵
America's investment boom has affected every part of the country, but intentionally wasn't spread evenly across the US
In particular, states building major chip fabs have had unprecedented construction growth—that's Arizona (+$36B,+430%), Texas (+$41B,+84%), & Ohio (+$20B,+200%)
Regionally, America's recent manufacturing investment boom has served to defend growth in the Rust Belt while accelerating growth in the Sun Belt—and outside of some semiconductor fabs planned for NY & Oregon, those dynamics should continue going forward.