Climate Impact of Decreasing Atmospheric Sulphate Aerosols and the Risk of a Termination Shock
Today I presented our first findings during the Annual Aerosol Science Conference of @AerosolSociety
@DrJamesEHansen @SkyECHO_Yann #COP26
1/9🧵
Today I presented our first findings during the Annual Aerosol Science Conference of @AerosolSociety
@DrJamesEHansen @SkyECHO_Yann #COP26
1/9🧵
Significant reduction in atmospheric sulphate aerosols contributes to albedo reduction, acceleration in Earth’s Heating Rate and could cause an aerosol termination shock.
2/9
2/9
Global warming to date is caused by greenhouse gases, but sulfur emissions cool ~-0.5°C, hiding part of warming.
Global shipping was responsible for a large part of anthropogenic emissions of sulfur over oceans.
3/9
Global shipping was responsible for a large part of anthropogenic emissions of sulfur over oceans.
3/9

Most Earth Heat Gain from increased greenhouse gas concentrations warms oceans, which cover 71% of Earth surface and absorb ~89% of heat gain.
Sulfur emissions from shipping reduced with ~80% from 2020 from regulation of the International Maritime Organization (IMO2020).
4/9
Sulfur emissions from shipping reduced with ~80% from 2020 from regulation of the International Maritime Organization (IMO2020).
4/9

Emission regulation of IMO decreased sulfur emissions over seas and oceans over Emissions Control Areas, with ~90% from 2015 and globally with ~80% from 2020.
5/9
5/9

Models show large uncertainties in the effect of the ~80% reduction in global shipping. The low end would't be measurable and the high end could result in rapid regional and global warming.
6/9
6/9

Differences in forcing estimates are caused by uncertainties in aerosol load, atmospheric lifetime, relative emission of direct SO4, DMS, emission distribution and seasonal variability.
7/9
7/9

The past two decades saw an albedo decrease and an increase in planetary heat uptake, coinciding with a decrease in anthropogenic sulfur emissions.
8/9
8/9

This trend could accelerate further with more sulfur emission reductions.
An aerosol termination shock whereby rapid anthropogenic aerosol emission reductions cause rapid global warming, can not be excluded.
9/9
An aerosol termination shock whereby rapid anthropogenic aerosol emission reductions cause rapid global warming, can not be excluded.
9/9

Reflection of Earth (Albedo) is decreasing. Sulfur emission reduction could be a leading cause.
With less solar radiation reflected back to space, warming is accelerating.
Ship sulfur emission reduction contributes to rapid albedo decrease over the N Pacific and Atlantic Oceans.
With less solar radiation reflected back to space, warming is accelerating.
Ship sulfur emission reduction contributes to rapid albedo decrease over the N Pacific and Atlantic Oceans.

Compliance to low sulfur fuel regulations for shipping looks very strong, based on inspections of compliance, low sulfur fuel sales and scrubber installations.
11/x
11/x

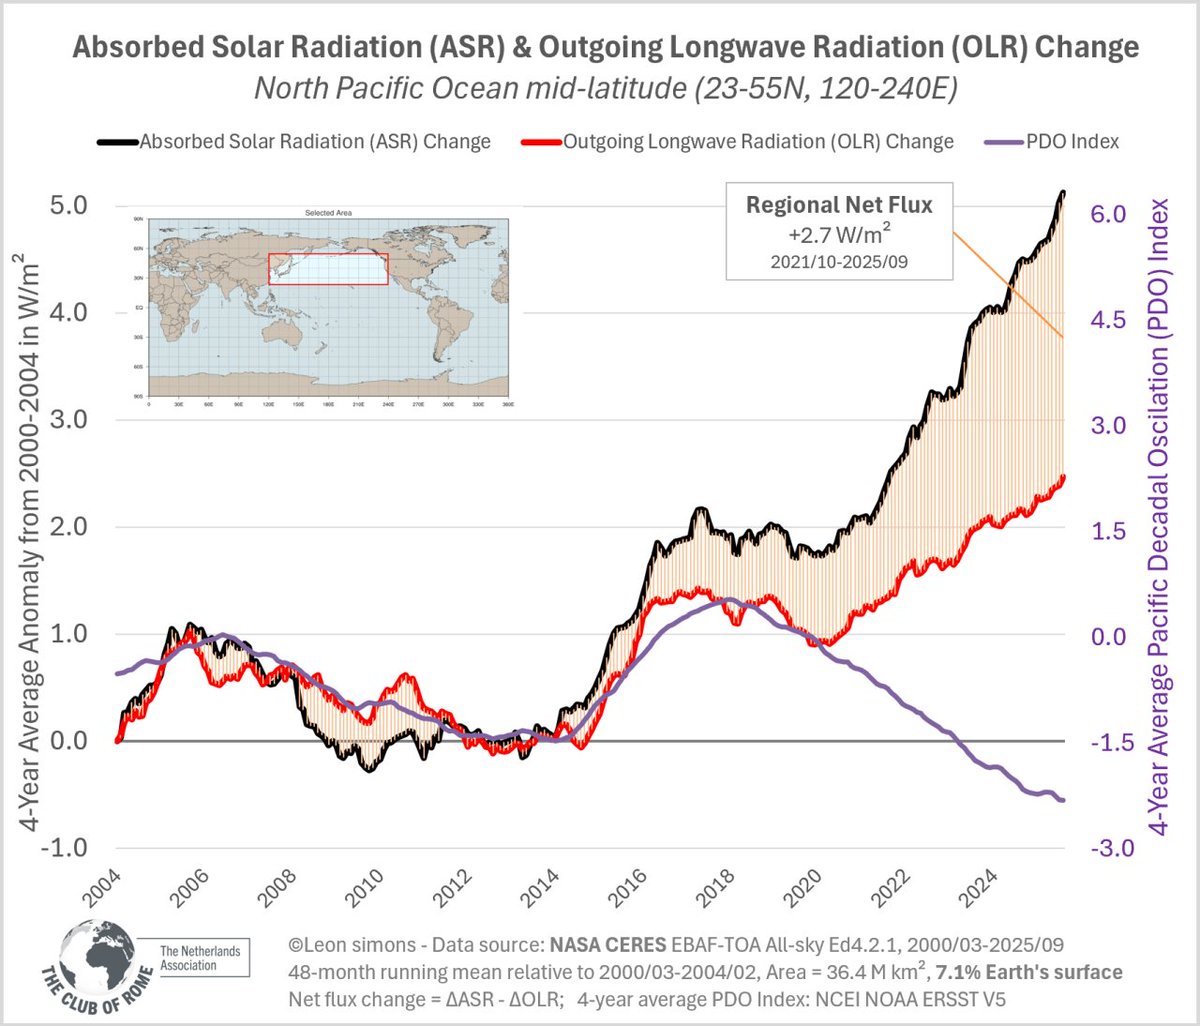
There already is an observed increase in the rate of Earth net heat uptake.
More solar radiation is absorbed from a decrease in cloud cover and surface albedo (mainly from melting of ice).
A warmer Earth radiates more heat, while more water vapor and other GHGs absorb IR.
12/x
More solar radiation is absorbed from a decrease in cloud cover and surface albedo (mainly from melting of ice).
A warmer Earth radiates more heat, while more water vapor and other GHGs absorb IR.
12/x

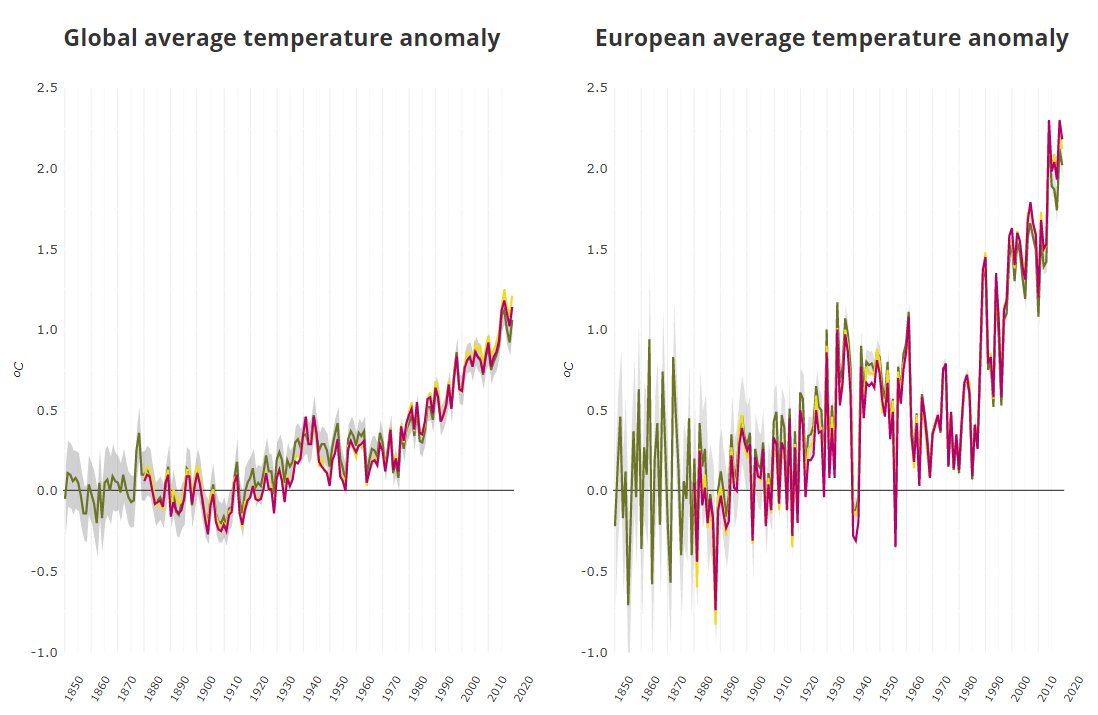
A well documented change in emissions and cloud changes happened over Europe since the 1980s
Large scale reduction in SO2 emissions coincided with a cloud cover reduction of ~5% and an increase of annual sunshine of ~75 h/yr.
Global & European temp increase accelerated.
13/x
Large scale reduction in SO2 emissions coincided with a cloud cover reduction of ~5% and an increase of annual sunshine of ~75 h/yr.
Global & European temp increase accelerated.
13/x

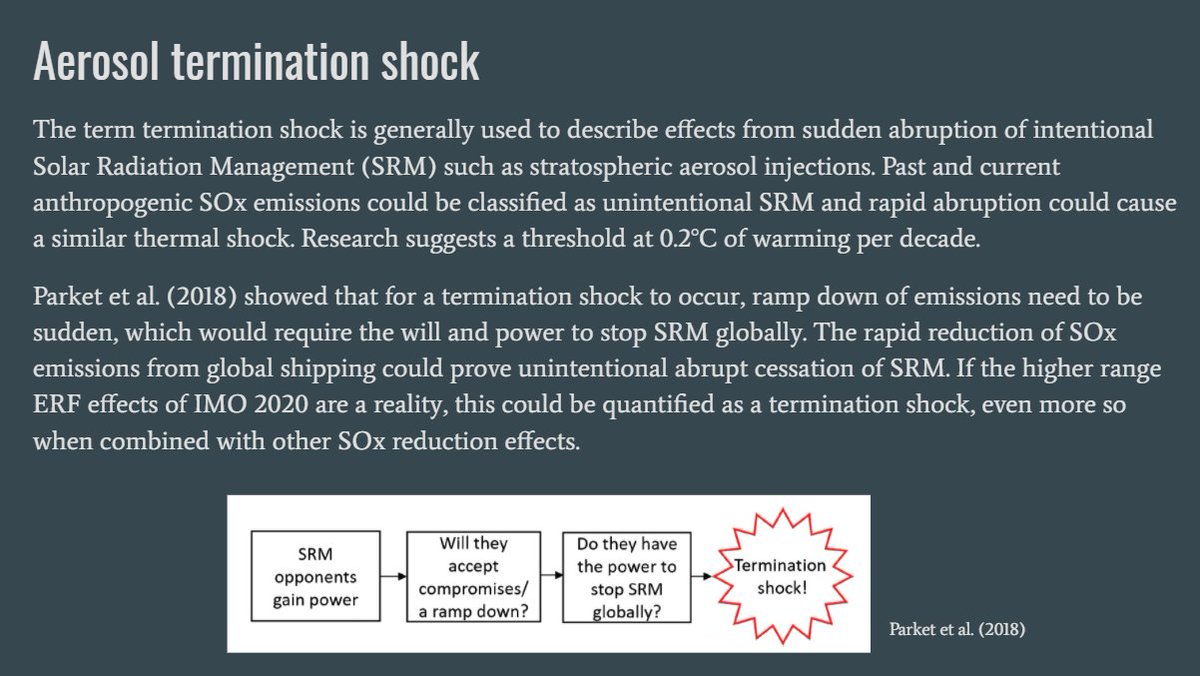
Rapid reduction of SOx emissions from global shipping could prove an unintentional abrupt cessation of SRM.
If the higher range ERF effects of IMO2020 are a reality, this could be quantified a termination shock, even more so when combined with other SOx reduction effects.
14x
If the higher range ERF effects of IMO2020 are a reality, this could be quantified a termination shock, even more so when combined with other SOx reduction effects.
14x
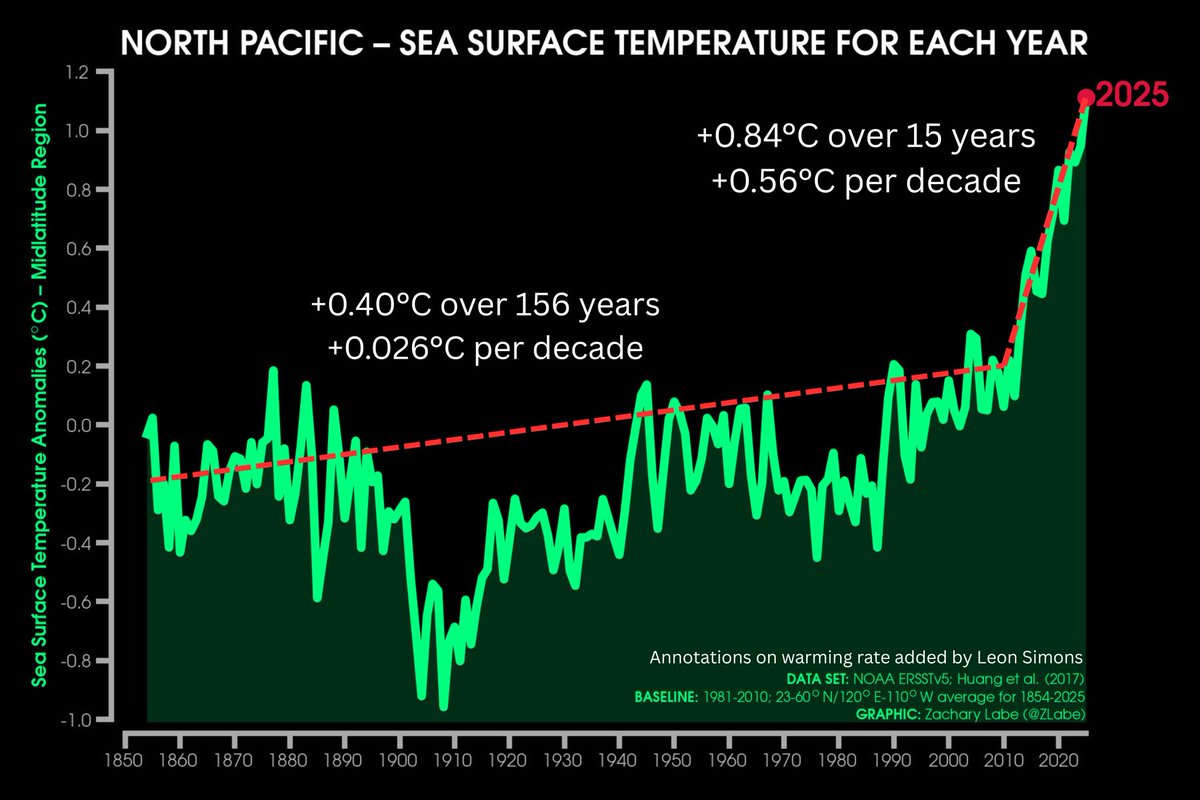
There is a strong upward trend in the increase of Absorbed Solar Radiation globally and even more pronounced over the N Pacific Ocean and N Atlantic Ocean, both areas of high shipping density, where sulfur emissions were reduced the last decade and more from 2020.
15/x
15/x


The North Pacific is a region of 37.1 million km² and if the trend of increase heat uptake continues, this could have significant consequences for the regional and global energy balance and climate.
16/x
16/x


The North Pacific Ocean absorbs about 80'000 GW more solar heat since 2020 than before 2010, which is before any significant sulfur regulations for shipping came into effect.
17/
17/
On the other side of the Arctic Ocean is the North Atlantic Ocean. This region of 22.2 km² now absorbs about 50'000 GW of solar heat more than in the period before ship regulations.
18/
18/

Total absorbed solar heat increase in these two regions is ~130'000 GW. Compare this to the average total human energy use of about 19'000 GW.
This is a lot of additional heat available to warm seawater, melt ice, heat the atmosphere, increase rainfall, storm intensity etc.
19/
This is a lot of additional heat available to warm seawater, melt ice, heat the atmosphere, increase rainfall, storm intensity etc.
19/
With the limited time since the IMO 2020 regulation has come into effect, the long term effect of this significant reduction in sulfur emissions is still uncertain.
Natural variability (ENSO, volcanoes, forest fires, dust storms) can temporarily change the radiation balance.
20/
Natural variability (ENSO, volcanoes, forest fires, dust storms) can temporarily change the radiation balance.
20/
Human aerosol emissions and reduction thereof will keep impacting the climate.
Further global reduction in sulfur emissions is expected from health and environmental policies, cleaner fuel use and installation of desulfurization systems, mainly at coal fired power plants.
21/
Further global reduction in sulfur emissions is expected from health and environmental policies, cleaner fuel use and installation of desulfurization systems, mainly at coal fired power plants.
21/

*22.2 million km² that is of course..
This an updated and improved version of the graph.

These desulfurization systems are enormous.
These images show the decommissioning of a flue gas washer at an old coal fired powerplant in The Netherlands.
22/
These images show the decommissioning of a flue gas washer at an old coal fired powerplant in The Netherlands.
22/

Europe saw the largest quantity in sulfur emissions in the world, about 60 million tonnes SO₂ per year around 1980.
Therefore the largest effect of reduction in emissions is expected and seen over Europe:
Therefore the largest effect of reduction in emissions is expected and seen over Europe:
https://twitter.com/LeonSimons8/status/1649019214299004928?s=20
On shipping emissions, see also this thread:
https://twitter.com/LeonSimons8/status/1633566568528375811?s=20
• • •
Missing some Tweet in this thread? You can try to
force a refresh