
Host of Climate Chat | Plain climate science & DATAVIZ | Mission: To Understand and Protect the Home Planet
 We talked about this in detail on Climate Chat:
 Figuring out what underlying assumptions in models are is much harder than you'd think.
 Ice melt: ~1.5 ZJ = 1 cm
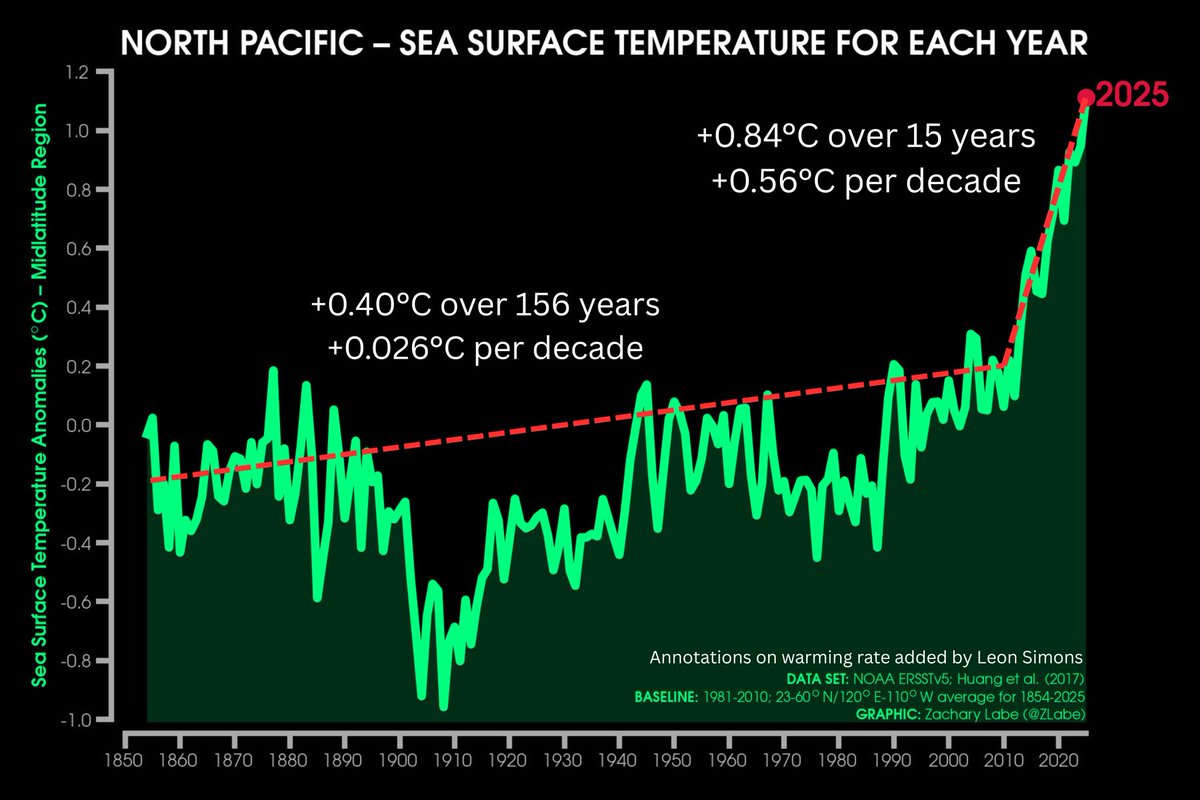
 @DrJamesEHansen Global warming has accelerated, which can't be explained by natural variability
 As more and more clean air regulations came into effect from the 1960s onward, CO₂ and sulphur dioxide (SO₂) emissions gradually decoupled.
 2024 even broke the extreme Sea Surface Temperature record of 2023:


 This is one of the most worrying studies I've seen in a long time.
  The average of the past 17 months was +1.60 °C above the 1850-1900 preindustrial baseline in the @CopernicusECMWF ERA5 dataset.
 @WMO @MercatorOcean This was highlighted today by @WMO's Secretary General State of Climate 2024 update

 This is not just about a single month or small region of the globe.
  “We shouldn’t rely on natural forests to do the job. We really, really have to tackle the big issue: fossil fuel emissions across all sectors,” says Prof @PFriedling
  @IPCC_CH Every climate scientist worth their salt knows and understands this.
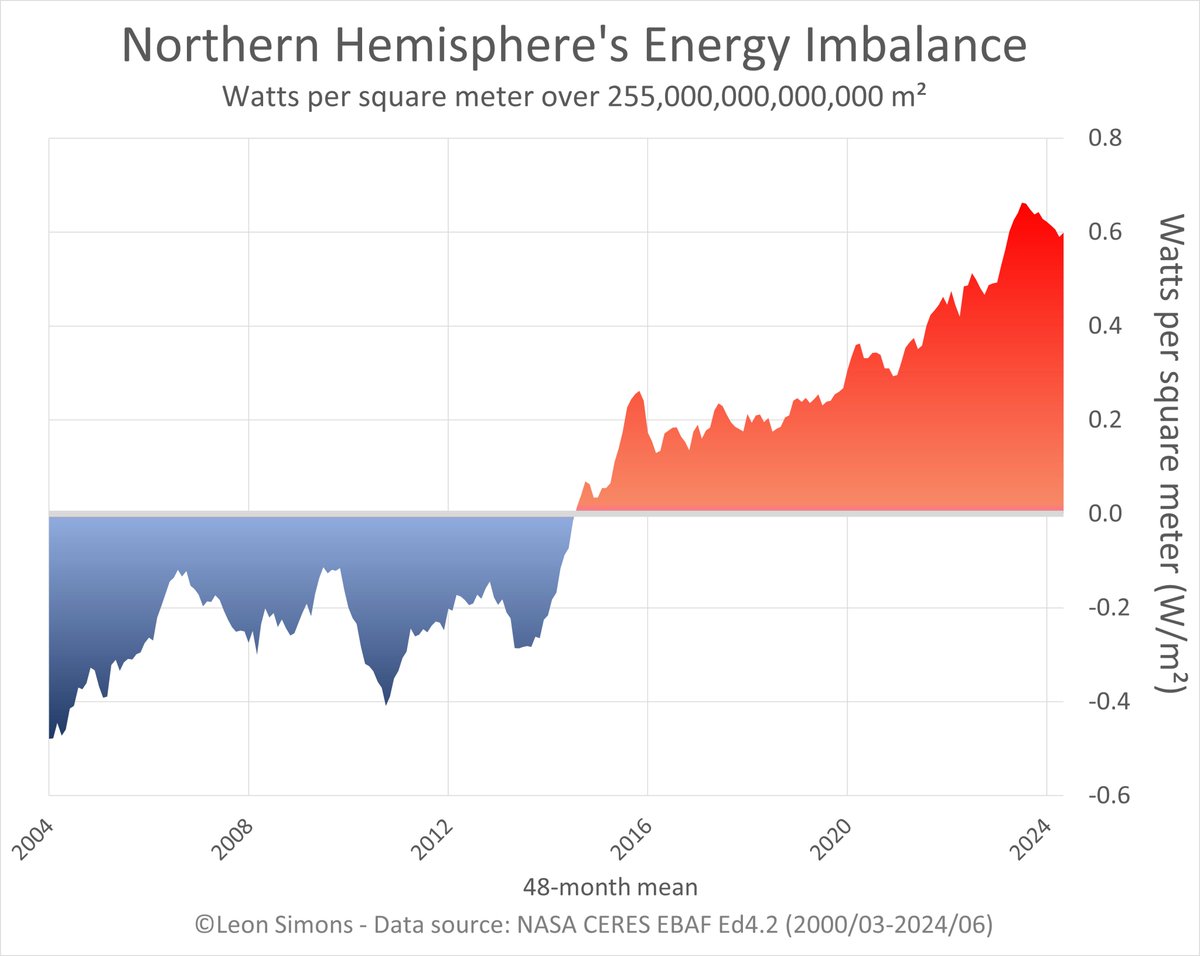 For the first time @NASA CERES satellite data shows the Northern Hemisphere absorbing more sunlight (48-month average of 242.2 W/m²) than the Southern Hemisphere.
 The past two months were similar to 2023.
 2/
2/ The Mediterranean covers less than 1% of global oceans, while supporting 20% of seaborne trade!
