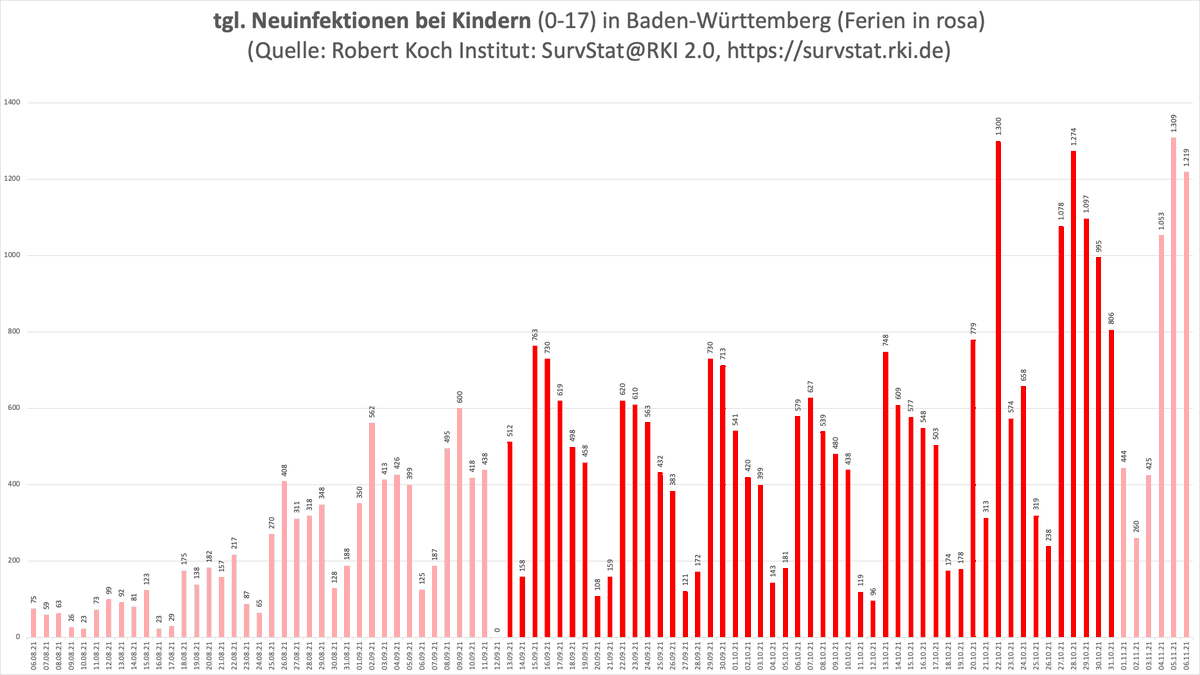
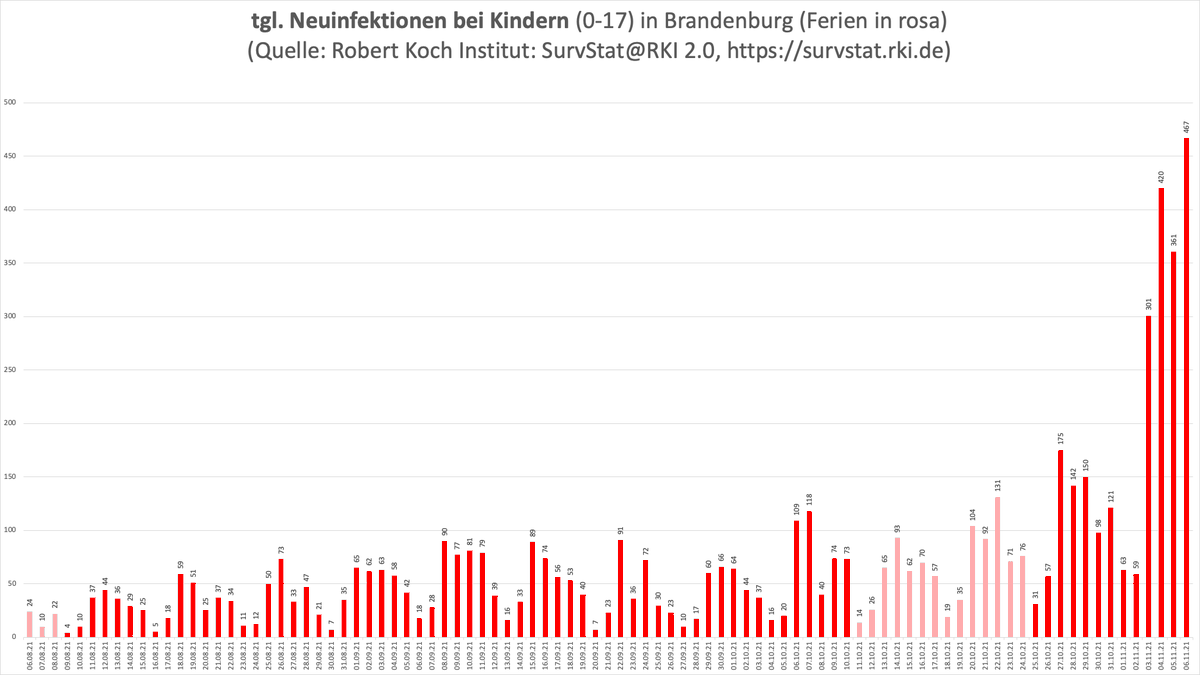
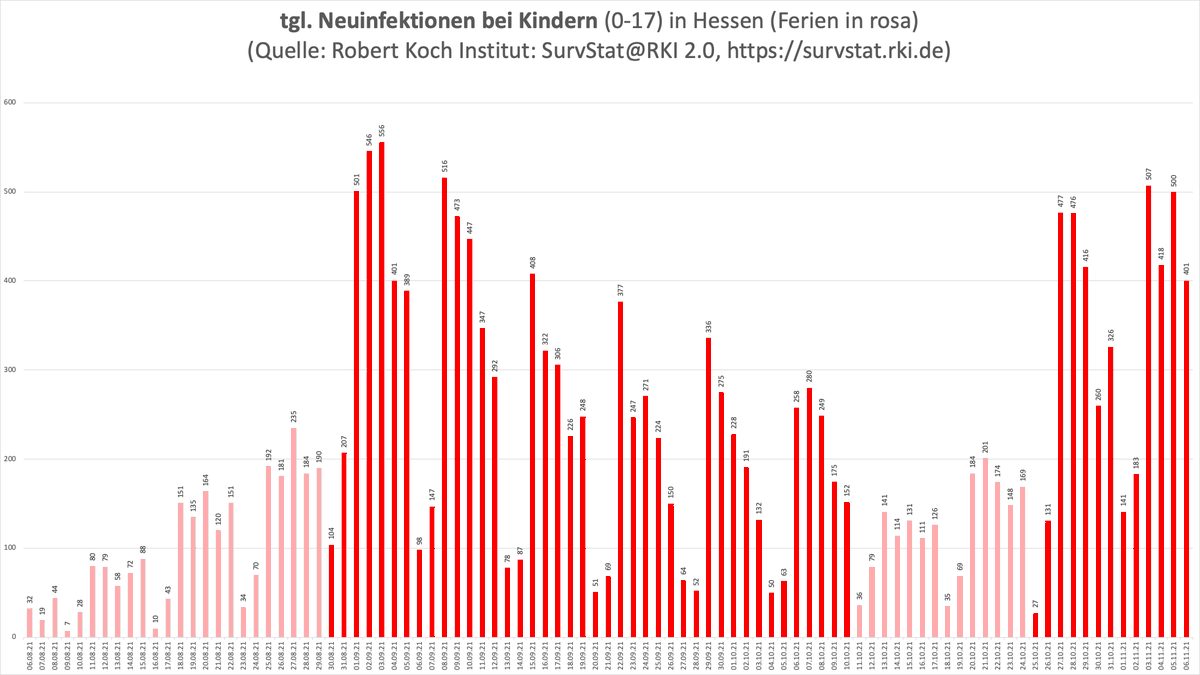
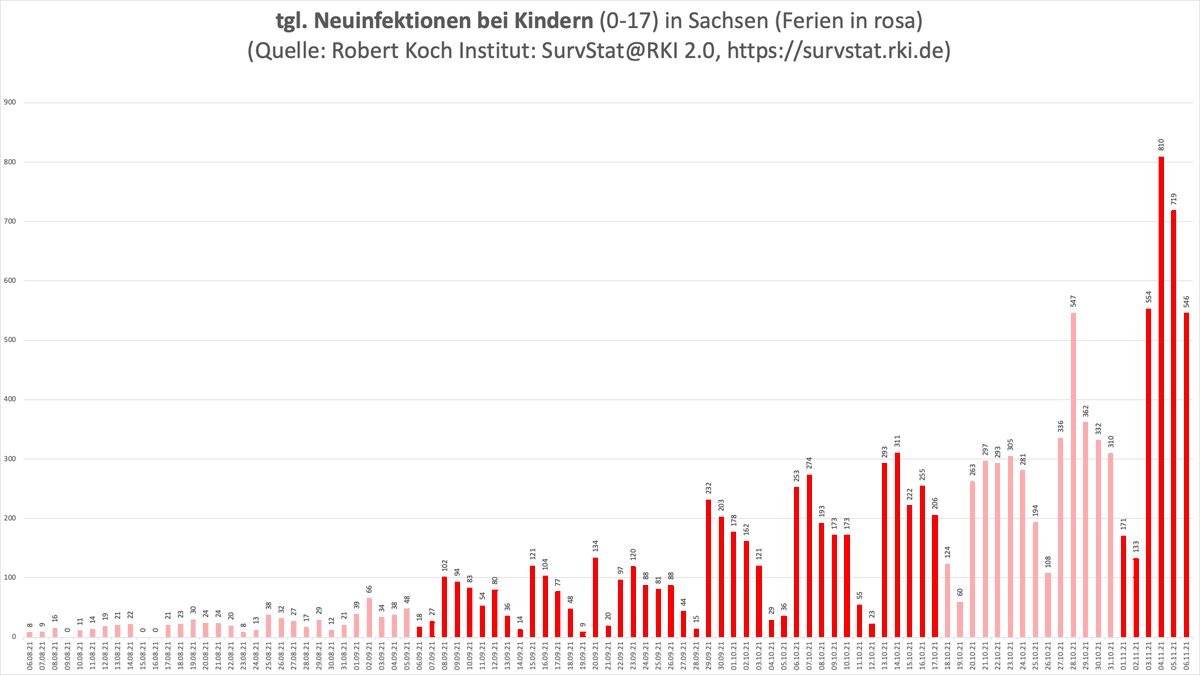
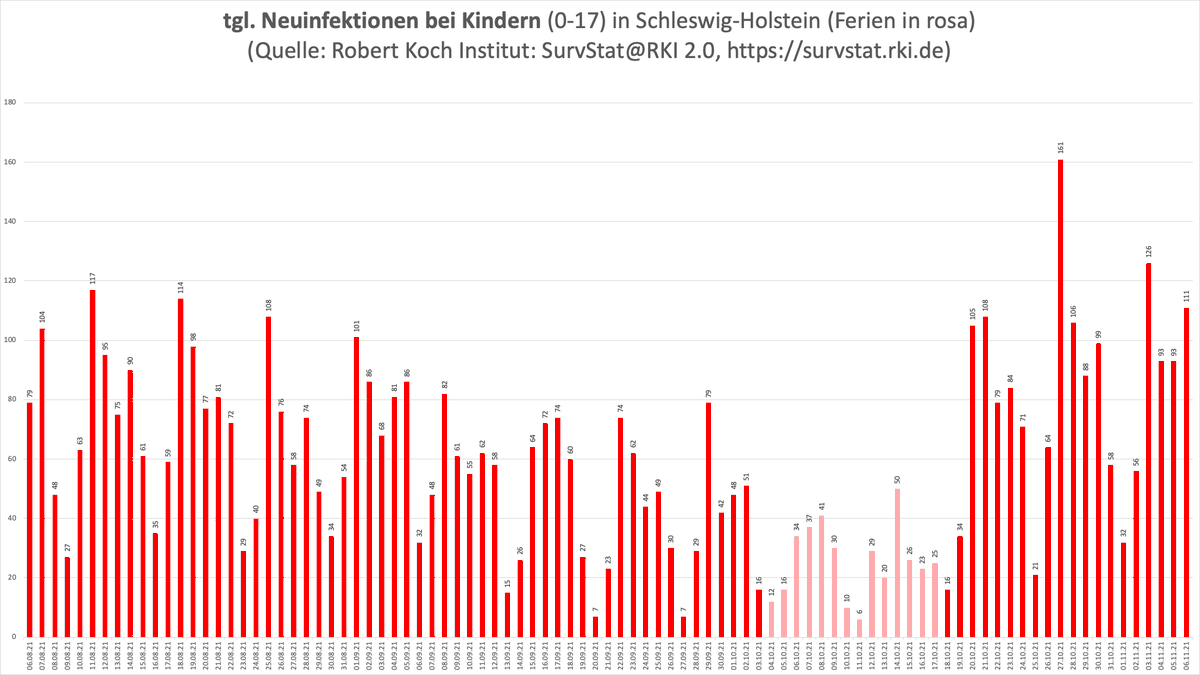
Nachdem ich meine Daten rekonstruieren konnte und in Excel gleich noch etwas optimiert und automatisiert habe, hier nun die aktuellen Grafiken der einzelnen Bundesländer. Bedient euch! Zeigt sie euren Landesregierungen!

⬇️ tgl. Kinderinfektionen pro Bundesland ⬇️

• • •

Missing some Tweet in this thread? You can try to force a refresh
 

Keep Current with 🔴😡🔴 Torben Johannson 😷

🔴😡🔴 Torben Johannson 😷 Profile picture

Stay in touch and get notified when new unrolls are available from this author!

Read all threads

This Thread may be Removed Anytime!

PDF

Twitter may remove this content at anytime! Save it as PDF for later use!

Try unrolling a thread yourself!

how to unroll video
  1. Follow @ThreadReaderApp to mention us!

  2. From a Twitter thread mention us with a keyword "unroll"
@threadreaderapp unroll

Practice here first or read more on our help page!

More from @BunterLotentony

7 Nov
7.11.2021

Hier gibt es tgl. alle Grafiken zum aktuellen Infektionsgeschehen bei Kindern (0-17) nach Bundesländern basierend auf SurvStat 🧵⬇️

Gern verbreiten!
7.11.2021

7-Tage-Inzidenzen nach Alter und Bundesland

(erstmals vierstellig)
7.11.2021

7-Tage-Inzidenzen nach Alter und Bundesland im historischen Verlauf

neue Rekorde: BB, HH, MV, SN, TH & D-gesamt (nicht abgebildet)
Read 42 tweets

Did Thread Reader help you today?

Support us! We are indie developers!


This site is made by just two indie developers on a laptop doing marketing, support and development! Read more about the story.

Become a Premium Member ($3/month or $30/year) and get exclusive features!

Become Premium

Too expensive? Make a small donation by buying us coffee ($5) or help with server cost ($10)

Donate via Paypal Become our Patreon

Thank you for your support!

Follow Us on Twitter!

:(