Alasdair Rae Profile picture
Nov 7, 2021 13 tweets 7 min read Read on X
Filed under:

'random Canadian-Scottish geography questions you can answer quickly while having your breakfast at the weekend'

- I may also have calculated the Scottish-Latitude population of Canada while I was at it, surprisingly low Image
plus, not everyone knows that the northern bits of Shetland are further north than the southern tip of Greenland - and even when you hear this you are duty-bound to check it yourself on Google maps because it sounds made up ImageImage
the answer to my vital question, thanks to some 10km gridded data, is that a little over 570,000 people would appear to live at Scottish latitudes in Canada, and I think we can all sleep easy now

open.canada.ca/data/en/datase…
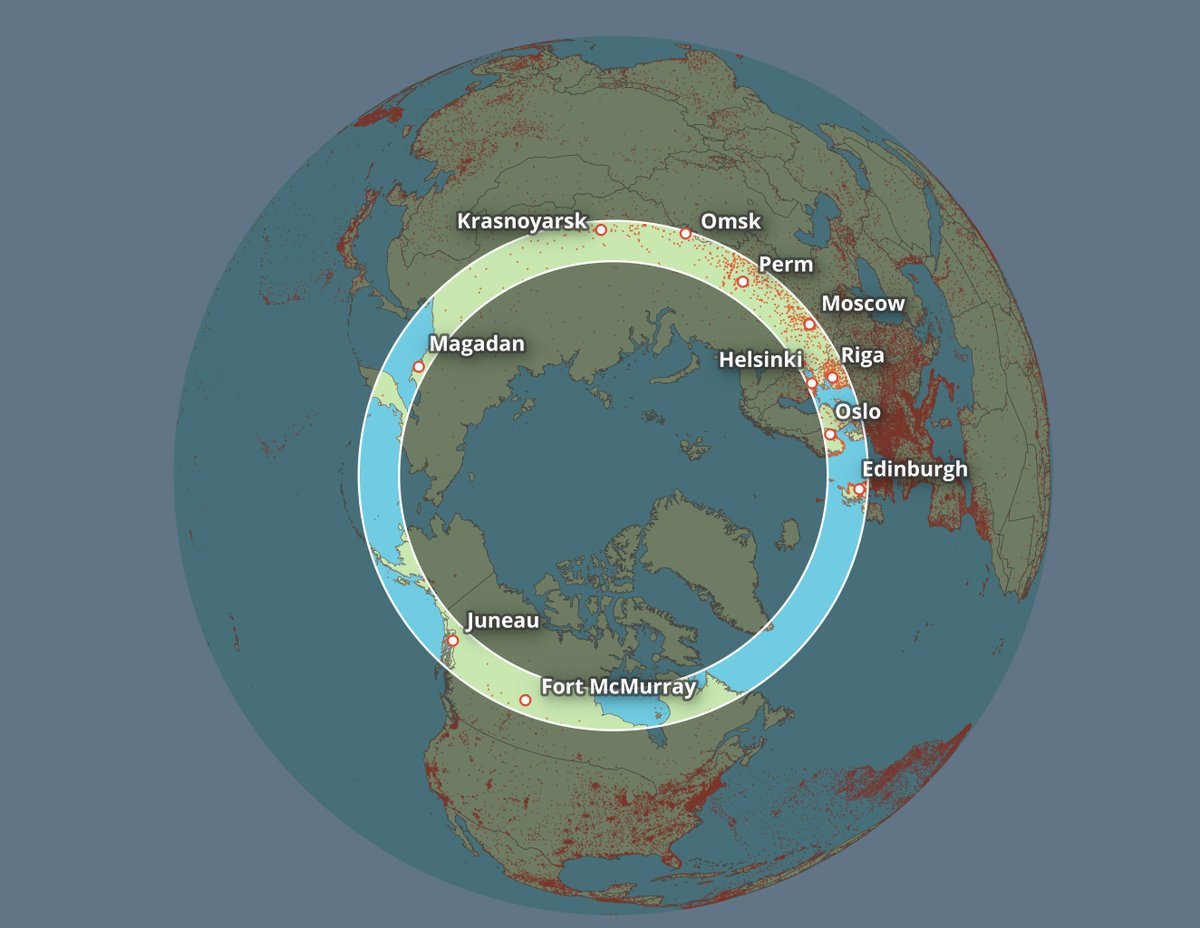
to end this little 'We the North' thread, I'll add in a global Scotland-latitudes donut map with a few places labelled - area shown in bright circle is roughly between 54.63 (Mull of Galloway) and 60.85 degrees north (Muckle Flugga) Image
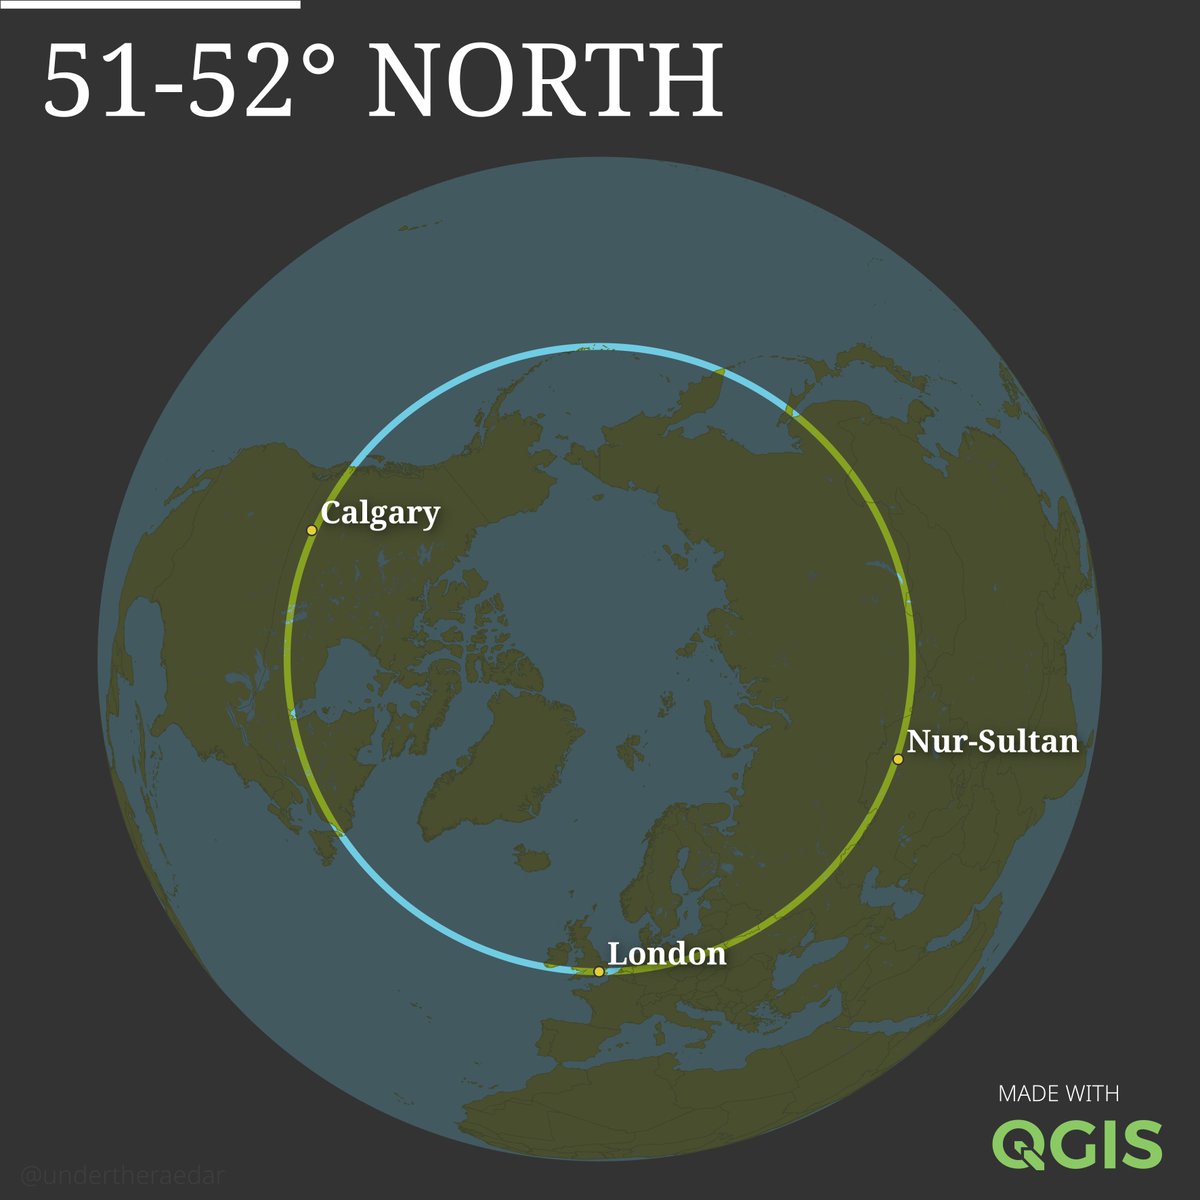
putting together more training datasets and finding out all sorts of interesting 🤓 stuff that I probably sort of already knew but hadn't seen in a latitude donut map before ImageImageImage
probably should include New Zealand latitudes in this thread as well Image
north isn't actually a direction at all but a state of being, a mindset, a way of life and did you know more than 2,000 people live in Longyearbyen in Svalbard (an entirely visa-free zone, as it happens - see the Svalbard Treaty) ImageImageImageImage
I've never been, but Svalbard Museum did once send me a very warm hat! (made in New Zealand)

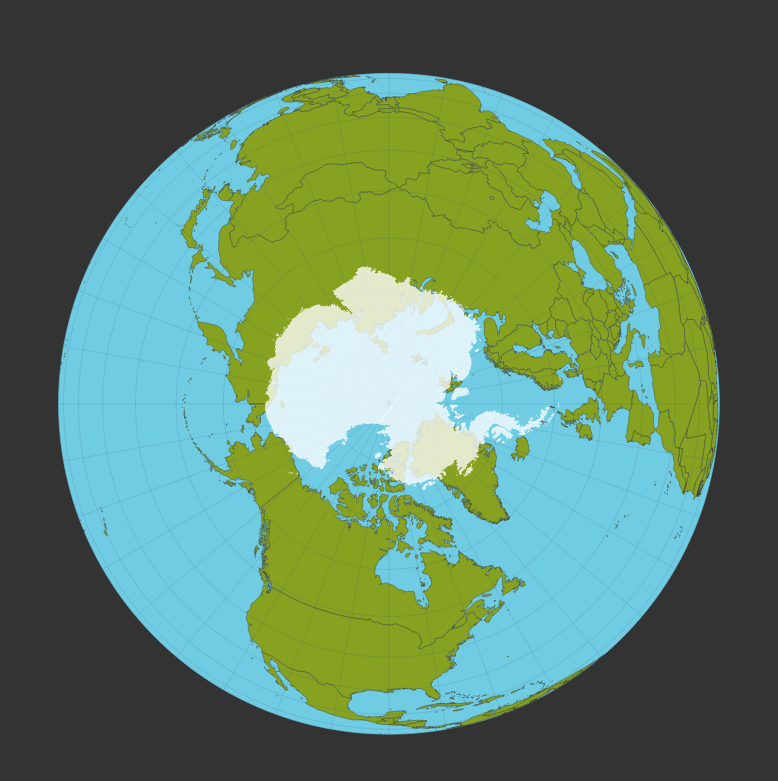
these different polar coordinate systems are a) quite a good way of teaching/learning about projections, b) an interesting way of looking at the world, and c) good for making 'what's at the top vs what's at the bottom' comparisons - e.g. 👇 ImageImageImage
one last tip for anyone looking to try this - in QGIS you can just right-click > Copy Coordinate > and then hit the Map CRS - option to identify any lat/long you want, or Set Custom CRS... to add a different coordinate system to the list and copy lat/long - it's quite handy ImageImage
I'm planning to do a little write up of methods on all this on my blog fairly soon, including how to very quickly create a glowy globe in QGIS with just a few layers of free data Image
adding Nova Scotia to this thread, as suggested by @Arnold_Platon Image
borrowed the colours from the very excellent Nova Scotia flag, obviously Image

• • •

Missing some Tweet in this thread? You can try to force a refresh
 

Keep Current with Alasdair Rae

Alasdair Rae Profile picture

Stay in touch and get notified when new unrolls are available from this author!

Read all threads

This Thread may be Removed Anytime!

PDF

Twitter may remove this content at anytime! Save it as PDF for later use!

Try unrolling a thread yourself!

how to unroll video
  1. Follow @ThreadReaderApp to mention us!

  2. From a Twitter thread mention us with a keyword "unroll"
@threadreaderapp unroll

Practice here first or read more on our help page!

More from @undertheraedar

Apr 4
I saw this Met Office 'UK climate districts map' online so naturally I decided to try and figure out the population of each area whilst eating my lunch and these are the incredibly interesting results
Image
Image
there is also the Met Office "climate regions" map but that's a can of worms that I don't want to open, not least because of the unwavering England N / England S line

metoffice.gov.uk/research/clima…
Image
when you plonk the Met Office climate districts on top of a map then you get something like this Image
Read 10 tweets
Feb 6, 2023
Okay, some European population density stuff now - starting with the top 100 1km grid squares by population across Europe, based on the most recent Eurostat data - more to follow
these are the top 3 by density, but I've shared a web folder with all 1km grid squares with more than 30,000 people living in them, as well as the top square in each of the 38 countries in the dataset

drive.google.com/drive/folders/…
they're all really interesting to me, but I particularly liked Gijón, Bucharest and Valletta
Read 35 tweets
Jan 13, 2023
Topical retweet because I've been watching The Rig but also the news - I remember first seeing these when I was about 10 when playing football in Invergordon and we couldn't believe the size of them
if you want to get a sense of the scale, look at the size of the people cutting up this old rig in Invergordon last summer
the Cromarty Harbour folk have done some nice street view imagery of the firth, e.g.

google.com/maps/@57.68775…
Read 4 tweets
Jan 13, 2023
Another very interesting recent England and Wales Census 2021 release is the passport data, so here's a map of % with no passport at MSOA level, will add a couple more below
these are all the different columns in the dataset (TS005Passports held) and the patterns are quite interesting, although I've only done a few maps as a way to explore the data

nomisweb.co.uk/sources/census…
the % with Irish passport map looks like this - probably about what I'd have expected
Read 11 tweets
Jan 6, 2023
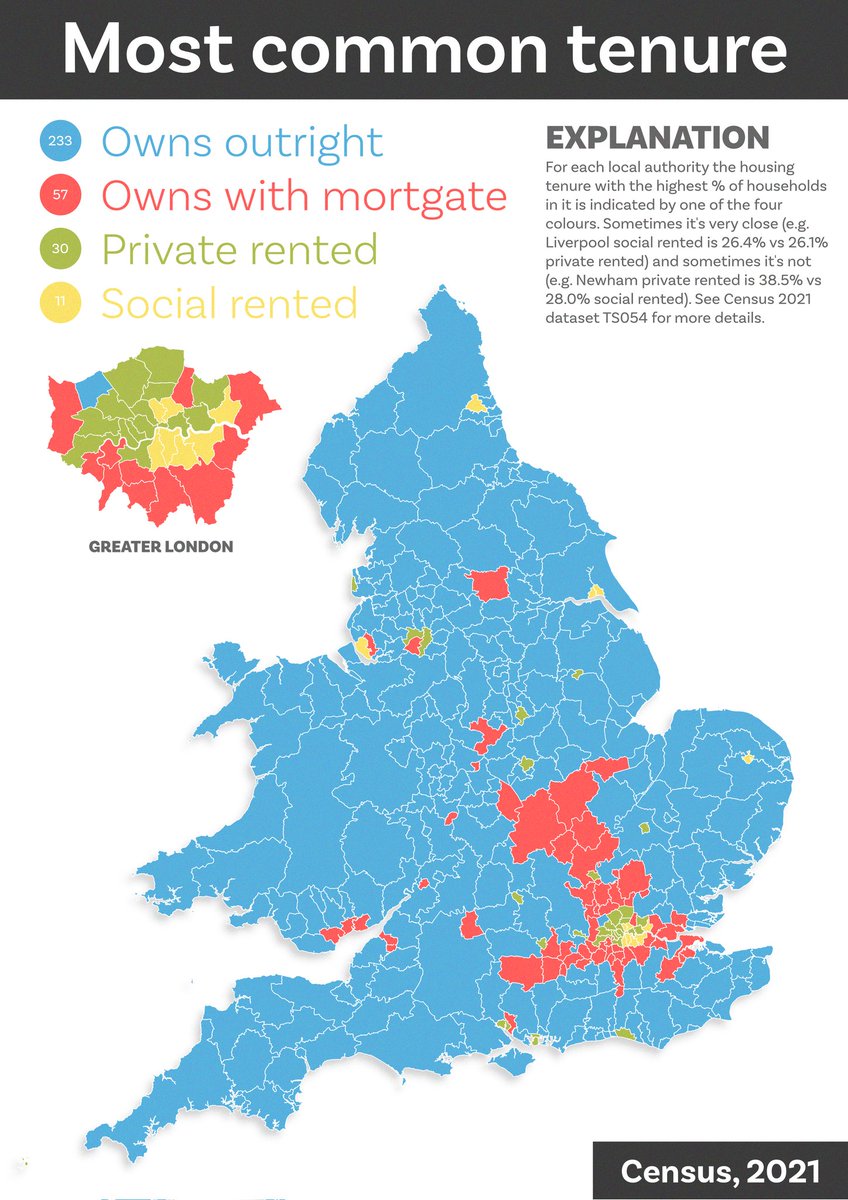
Today's census map shows the most common housing tenure in each local authority in England and Wales 🏡
I'm working on my spelling of mortgage, probably due to the shock of seeing how many households own without a mortgage!
most common by area is of course a very first-past-the-posty representation of things but I'm interested in the pattern precisely because of this - will fix typo later, perhaps I should do by constituency too
Read 11 tweets
Jan 5, 2023
More Census age data today - a little animation of % by single year of age in each local authority. Probably needs a few watches to sink in - lots in here - but the final 10 seconds I find quite sombre, and you'll NEVER guess when lots of people leave home
and, just to go all dataviz retro, here are all the frames as small multiples
nerd note: lots of ways to make small multiples from image sets but I tend to use ImageMagick, and the image above was created using this command:

montage *.png -tile 10x10 -geometry +5+5 age-by-year.png

Once you have a set of files it only takes a few seconds to run
Read 4 tweets

Did Thread Reader help you today?

Support us! We are indie developers!


This site is made by just two indie developers on a laptop doing marketing, support and development! Read more about the story.

Become a Premium Member ($3/month or $30/year) and get exclusive features!

Become Premium

Don't want to be a Premium member but still want to support us?

Make a small donation by buying us coffee ($5) or help with server cost ($10)

Donate via Paypal

Or Donate anonymously using crypto!

Ethereum

0xfe58350B80634f60Fa6Dc149a72b4DFbc17D341E copy

Bitcoin

3ATGMxNzCUFzxpMCHL5sWSt4DVtS8UqXpi copy

Thank you for your support!

Follow Us!

:(