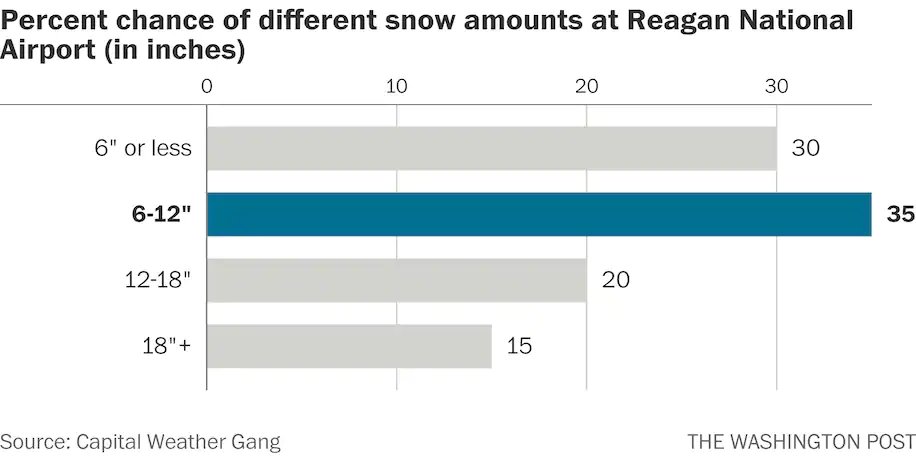
DC winter outlook THREAD: First, let's share our snowfall map--these are our predicted amounts for the ENTIRE winter. While not particularly impressive, they would beat last winter's totals: 1/x
An important note on the snowfall forecast: While we're predicting below-average amounts for the 5th time in the past 6 winters, it would just take one blockbuster storm to surpass it. The thing is though, La Ninas - which we have this year - lower the odds of a big snow. 2/x
During La Ninas, winter storms tend to track to our west, drawing in mild air from the south. So we can get some snow, but usually in modest amounts before it changes to ice and rain. 3/x
Interestingly, there's a strong consensus among long-term forecasters that DC will have below-average snow & near to above average temps this winter. We polled a bunch and everyone's ideas are remarkably similar. 4/x @BigJoeBastardi@tcrawf_nh@judah47@PaulPastelok@commoditywx
Also, not to be lost in the discussion of our winter outlook is that climate change plays into it. DC's average winter temp has risen 3-5 degrees since 1970 and our snowfall is in a long-term decline. 5/x
Producing a winter outlook is a good deal of work, involving research, a lot of writing (this one's over 2,000 words) and building graphics. Check it out for all of the details. wapo.st/3C2aqW2 6/6
• • •
Missing some Tweet in this thread? You can try to
force a refresh
New today: Capital Weather Gang's winter outlook. We lean toward slightly below normal snow this winter in DC but more than we've seen in the last several winters -- which have produced very low numbers. 1/x
The main reason most winter outlooks are calling for below normal snow for the DC area is because of La Nina, which -- on average -- brings below normal amounts. But this La Nina will probably be weak, if it develops at all. We think its influence may be limited. 2/x
That said, we'd be surprised if this is a banner year for snow lovers and think the prevailing storm track will be west of DC, meaning storms may start as snow or ice but flip to rain. 3/x
Maps, we love maps. They help tell the story of the summer.
First, here are all of the locations which had one of their top 5 hottest summers - June thru Aug - on record. DC is among them.
1/5
Here all the places that highs of 100+ and the number of times. Some places in the Southwest like Phoenix and Yuma were 100+ pretty much every day.
2/5
Over 250 places with at least 20 years of data set all-time highs during summer. They include Las Vegas; Fresno; Abilene, Tex.; Raleigh; Hagerstown, Md; and Caribou, Maine.
Crazy -- and not in a good way -- wildfires in Canada have erupted (fueled by warm, very dry conditions) -- just like they did at this time last year, and sending smoke into the Upper Midwest, where air quality is tanking. 1/4
Code red air quality -- signifying unhealthy levels of smoke pollution -- in Minnesota and Wisconsin this morning. Parts of southwest Canada have seen Code Purple air quality-- the worst level. 2/4
The fires are spreading fast because of widespread drought in Canada. Also, of note, even worse drought and record heat in Mexico are causing fires to spread and smoke is infiltrating the U.S. from the south, too!!! 3/4
We are under a level 4 out of 5 risk. The last time that happened locally was June 13, 2013; the previous time before that was the June 29, 2012 derecho. So the @NWSSPC sees ingredients in place for numerous dangerous storms in the area.
2/x
@NWSSPC We're most concerned about: 1) Downburst winds -- like we saw July 29 this year. @NWSPC sees 45% chance of winds over 58 mph within 25 miles of any point in our area & 10% chance of 75+ mph 2) Quick-hitting tornadoes -- a lower chance than downburst winds but possible
Common types of LED lights emit more blue light than traditional high-pressure sodium bulbs. Differences are seen in this 2020 image from the Space Station. Bluer LEDs appear in Baltimore, while older amber-colored lights spread across D.C.
The blue light in LEDs can lead to more light pollution. In Chelan County in Wash, pollution grew worse after streetlights were replaced w/LEDs. Additional glare masked about half the previously visible stars:
📷@PostGraphics w/National Park Service data https://t.co/xtVNOw2KlCwapo.st/3r3mNB3
This wildfire season in Canada is unlike anything it's ever seen to date. And part of a trend toward larger fires & more damaging fire seasons.
4.7 million hectares have burned; average year to date is 310,000.
Carbon emissions from fires through the roof
(1/5)
The land area burned so far in Canada has exceeded 5,000 percent of normal in some provinces. (2/5)
Some climate skeptics - to dismiss this year's fire activity - have pointed to decrease in number of fires in Canada over time. That is true, but prob b/c of improved prevention.
BUT, fires that burn have trended substantially BIGGER while summer temps have trended higher. (3/5)